
R D Peters†‡ BSc, P Mehta‡ BSc PhD C Eng MIEE and J Haddon† BSc C Eng MIEE MCIBSE
†Ove Arup & Partners
‡Brunel University
Received 23 January 1996, in final form 29 April 1996
Proc. CIBSE A: Building Serv. Eng. Res. Technol. 17 (4) 209-213 (1996). This web version © Peters Research Ltd 2010.
Summary
This paper presents mathematical formulae for analysis of passenger traffic using double decker lifts. The formulae are general allowing any possible traffic flow to be considered. A Poisson approximation of passenger arrivals at lift landing stations is assumed allowing probable number stops and average lowest and highest reversal floors to be calculated. Conventional techniques can then be used to calculate round trip time, interval and capacity factor. The calculations are iterative and require computer implementation.
List of symbols
| di,j | Probability of the destination floor of a call from i being the jth floor (i and j must be both odd or both even for di,j ≠ 0) |
| DOWNJOINi | Average number of passengers joining lift at ith floor on journey down |
| DOWNLEAVEi | Average number of passengers leaving lift at ith floor on journey down |
| FM | Figure of merit for use of double deck lifts (%) |
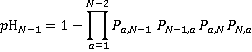
| Hrf | Average highest reversal floor of lower cab |
| Lrf | Average lowest reversal floor of lower cab |
| N | Number of floors (N ≥ 4 and even) |
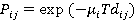
| Pij | Probability of no calls from the ith to the jth floor in the time interval T |
| pDSn-3 ... pDS3 | Probability that lower cab of lift will stop at intermediate floor on its journey down (subscript refers to floor at which lower cab stops) |
| pDSCn-3 … pDSC3 | Probability that the lift will stop at intermediate floors on its journey down with stops coincident to both cabs (subscript refers to floor at which lower cab stops) |
| pHn | Probability of nth floor being the highest reversal floor (subject refers to lower cab) |
| pLn | Probability of nth floor being lowest reversal floor (subscript refers to lower cab) |
| p(n)ij | Probability of n passengers travelling from the ith to the jth floor in the time interval T |
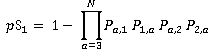
| pS1 | Probability that the lift will stop at the lowest floors (bottom cab floor 1, upper cab floor 2) |
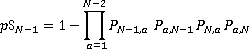
| pSN-1 | Probability that the lift will stop at teh highest floor (bottom cab floor N – 1, upper cab floor N) |
| pSC1 | Probability that the lift will stop at the lowest floor with the stop coincident to both cabs |
| pSCN-1 | Probability that the lift will stop at the highest floor with the stop coincidnt to both cabs |
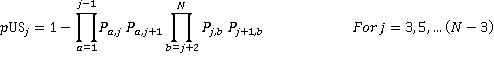
| pUS3,pUS5 … pUSn-3 | Probability that the lift will stop at intermediate floors on its journey up (subscript refers to floor lwer cab stops at) |
| pUSC3 … pUSCn-3 | Probability that the lift will stop at intermediate floors on its journey up with stops coincident to both cabs |
| S1 | Probable number of stops including terminal floors |
| Sc | Probable number of coincident stops |
| SPLIT(Q,i,j) | Proportion of passengers travelling from the ith to the jth floor who are using lifts in zone Q |
| T | Interval (s) |
| T(n) | Interval, zone n (s) |
| UpJoini | Average number of passengers joining lift at ith floor on journey up |
| UpLeavei | Average number of passengers leaving lift at ith floor on journey up |
| µi | Passengers arrival rate at floor i (person s-1) |
1 Introduction
Double-deck lifts have two separate cabs built into a single unit so that the upper and lower cabs serve adjacent floors simultaneously. During peak periods maximum operating efficiency is achieved by restricting the lower cabs to serving odd numbered floors, and the upper cabs to serving even numbered floors.
Double-deck lifts provide greater handling capacity per shaft than conventional lifts. This is particularly attractive for high rise buildings. The sacrifice is that double-deck lifts are less convenient for passengers. Occupants of even numbered floors are required to use escalators to reach the upper lift cab on their way into the building. And again to reach the exit on their way out. Passengers have to walk one storey when an inter-floor trip from an odd to an even numbered floor, or vice-versa, is made. To alleviate this problem, double-deck lift control systems can provide an odd-even floor service by operating in alternative modes out of peak times.
A more detailed discussion of the application of double-deck lifts and their control systems is presented in Reference 1.
The value of double-deck lifts in increasing the efficiency of lifting high rise buildings is recognised(1,2), and calculations for their performance during the simple up peak traffic scenario have been defined(3). This paper deals with the general case, allowing any practical configuration of double-deck lifts and any peak traffic flow to be considered.
Similar general formulae have previously been presented for conventional single deck lifts(3). It would be possible to extend these formulae for triple, quadruple, etc. deck lifts if required.
The calculations are based on calculating the probable number of stops and average reversal floors of a lift during its round trip. Lifts may be zoned to take into account the passenger split between different groups of lifts which may not be the same size, speed, etc, or which may not serve the same floors.
2 Poisson approximation
As previously discussed (4), it is generally accepted that the arrival of passengers at a lift landing station is reasonably approximated by a Poisson process. This gives the result:
 (1)
(1)
When calculating probabilities, it is generally easier to calculate the probability of something not happening and then subtract this from 1 to arrive at the probability of the event happening. So, let
Pi,j = p(0)i,j
which is the probability of no calls from the ith to the jth floor in the time interval T. From equation 1
 (2)
(2)
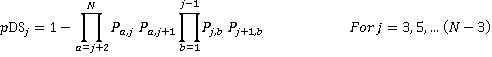
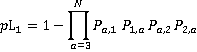
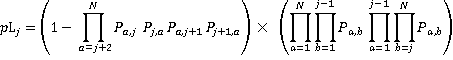
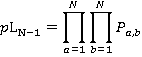
3 Probable number of stops
When calculating the probable number of stops, it is necessary to consider both the up and the down journey of the lift, as the lift may stop at a floor twice during a single round trip.
For traffic analysis the designer is concerned with peak periods, so it is reasonable to assume that lifts are operating in their most efficient, double-deck mode i.e., the lifts do not allow passengers to travel from odd to even floors or vice versa. This means that dodd,even and deven,odd must equal 0, which makes Podd,even and Peven,odd equal to 1.
The probability of a lift stopping at a floor is one minus the probability that there are no calls to or from odd floors to the lower cab times the probability that there are no calls to or from the even floors to the upper cab. This gives the results:
 (3)
(3)
 (4)
(4)
 (5)
(5)
 (6)
(6)
(∏ is a mathematical symbol meaning multiply all the terms over this range.)
The total number of stops S is calculated by adding together all the terms:
 (7)
(7)
4 Reversal floors
4.1 Reason for calculation
In an ‘average’ journey, a lift may not reach the highest or lowest floor of a building. (This is less likely for double-deck lifts than for conventional single deck lifts because double-deck lifts carry more passengers, so are increasingly likely to have to stop at all floors.) Calculating the average highest and lowest reversal floors allows the possibility of this shortened round trip to be taken into account. In this paper highest and lowest reversal floors have been calculated with reference to the lower lift cab i.e., the lowest possible is 1 and the highest possible floor is N –1 (Figure 1).
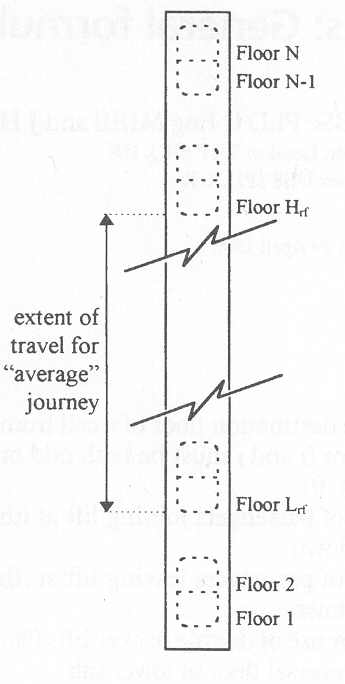
Figure 1 Highest and lowest reversal floors
4.2 Highest reversal floor:
The probability of the jth floor being the highest reversal floor is the product of the probability that there is a call from a lower floor to either the j th or the (j +1)th floor and the probability that there are no calls to or from floors above j +1:
 (8)
(8)
 (9)
(9)

 (10)
(10)
A good check for this is that

Given the probability of each floor being the highest reversal floor, the average highest reversal floor, Hrf is simply:
 (11)
(11)
4.3 Lowest reversal floor
Similarly, calculate the probability of the j th floor being the lowest reversal floor, which is the probability that there is a call from a higher floor to or from floors j or j +1 and the probability that there are no calls to or from floors below j:
 (12)
(12)
 (13)
(13)
 (14)
(14)
Again, a check for this is that

Given the probability of each floor being the lowest reversal floor, the average lowest reversal floor Lrf is simply:
 (15)
(15)
5 Capacity factor
In a conventional up peak traffic calculation it is assumed that the lift is say 80% full at the beginning of its round trip. This approach cannot be taken for a general calculation as people may enter or leave the lift at any floor. One approach is to calculate the average number of people in the car when it leaves each floor. But first calculate the number of people entering and leaving the lift at each floor.
At the i th floor, going up, the number of passengers joining the car is
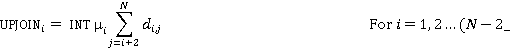 (16)
(16)
No passengers join the lift at the top floors to go up, so UPJOINN -1 = 0; UPJOINN = 0.
At the i th floor, going up, the number of passengers leaving the car is
 (17)
(17)
No passengers leave the lift at the bottom floors subsequent to an up journey, so UPLEAVE1 = 0; UPLEAVE2 = 0.
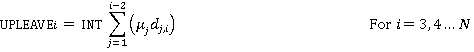
At the ith floor, going down, the number of passengers leaving the car is
For i = N, (N – 1), … (3):
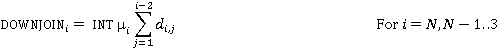 (18)
(18)
No passengers join the lift at the bottom floors to travel down so DOWNJOIN1= 0; DOWNJOIN2= 0.
At the i th floor, going down, the number of passengers leaving the car is
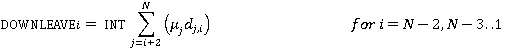 (19)
(19)
No passengers leave the lift at the top floors after a down journey so DOWNLEAVEN= 0; DOWNLEAVEN-1= 0.
Having calculated the average number of people joining and leaving the lift at each floor, determine the average number of people in the car when it leaves each floor travelling both up and down the building. Dividing the maximum value by the lift capacity (in persons) gives the capacity factor, which is normally expressed as a percentage.
6 Round trip time
The round trip time for a single lift is the sum of the travel time from lowest to highest reversal floors, the number of stops times the delay time associated with a stop, and the time for people to load and unload the lift. An example of conventional round trip time formulae applied to double-deck lift calculations can be found in Reference 3. Having calculated the round trip time for a single lift, the interval, T is the round trip time divided by the number of lifts, The interval is a common traffic analysis term representing the average time between successive lift arrivals at the main terminal floor.
The calculations are iterative as the result, T is required as an input to the calculations. T must be estimated, then the calculations repeated until the input T is equal to the result.
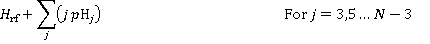
7 Figure of merit
The figure of merit for use of double-deck lifts is defined as being the percentage of stops that are coincident to both upper and lower cabs(3). A high figure of merit is preferable as it can be frustrating for passengers when the lift stops repeatedly and no-one leaves or enters their lift cab.
The figure of merit is not required as an input to the iterative round trip time calculation, so only needs to be determined once a solution for T has been found.
The probability of a stop at the j th and ith floors being coincident is the product of the probability of the lift needing to stop to serve a call to or from both j and j+1:
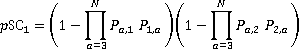 (20)
(20)
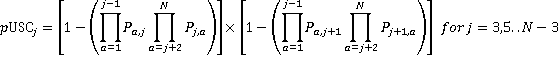 (21)
(21)
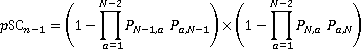 (22)
(22)
For j = 3, 5, … (N – 3):
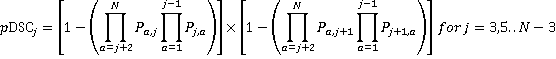 (23)
(23)
The total number of coincident stops Sc is calculated by adding together all the terms:
 (24)
(24)
Giving a figure of merit, expressed as a percentage:
FM =  (25)
(25)
8 Overlapping zones
Lifts which serve the same floors and are of the same size, speed, capacity, etc. may be defined as being in a zone. If different zones do not serve the same floors, treat each as being independent, carrying out round trip time calculations for each zone separately. However, if a passenger could use lifts in either of two or more zones to make a journey, zones are ‘overlapping’ and it is necessary to split up the passenger traffic between zones before carrying out the calculations. The results given for the single deck lifts in Reference 4 also apply for double-deck lifts:
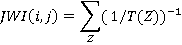 (26)
(26)
where (Z) = {all zones serving both the i th and the j th floor}
SPLIT(Q,I,j) = JWI(i,j)/T(Q) (27)
9 Examples
9.1 Analysis data
The validity of any lift traffic calculation is dependent on reliable analysis data. CIBSE Guide : Transportation Systems in Buildings (4) provides a summary of current thinking.
9.2 Up peak analysis
Consider a 22 storey office building with 2000 m2 net area per floor where the 5 minute up peak handling capacity required is 16%. Analyse the performance of eight 2.5 m s-1, 1800 kg/1800 kg lifts. Assume the additional parameters given in Table 1.
Table 1
| Poplulation density | 1 person per 15m2 |
| Storey height | 3.6m |
| Passenger weight | 75kg |
| Passenger transfer | 1.2s in, 1.2s out |
| Round trip time | 5% inefficiency |
| Door operating times | 1.8s open, 2.9s close |
| Acceleration | 0.8ms-3 |
| Jerk | 2ms-3 |
| Motor start up delay | 0.5s |
The passenger traffic can be represented as shown in Figure 2. Calculations are calculated according to the flow chart in Figure 3.
Results from the authors’ computer program implementing the formulae are summarised as in Table 2.
Table 2
| Capacity factor | 76% |
| Probable number of stops | 10.7 |
| Lowest reversal floor | Level 1 |
| Highest reversal floor | Level 21* |
| Interval | 25.6s |
| Figure of merit | 75% |
| * Reversal floors output to nearest floor |
9.3 Lunch peak analysis
For a more complex example, consider the lunch peak in an office building where there are double storey conference restaurant facilities on the top two floors. Consider the scenario when a morning conference ends during the lunch time peak. Conference delegates are visitors to the building. The peak traffic is a combination of:
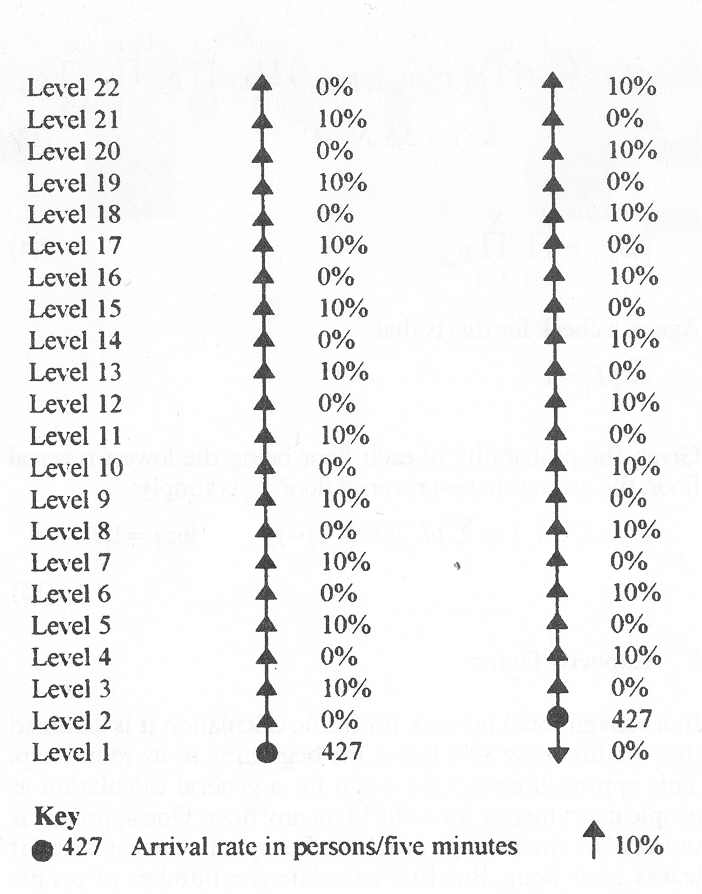
Figure 2 Example of up peak traffic flow
- resident passengers travelling from their offices t the restaurant for lunch
- resident passengers travelling back to their offices after lunch
- resident passengers travelling to the ground floor to leave the building to buy sandwiches or eat out
- resident passengers returning from buying/eating lunch out
An example traffic flow is given in Figure 4. Assuming this traffic flow, analyse eight 2.5 ms-1 1259 kg/1250 kg lifts using the additional input parameters given in Table 3.
Table 3
| Storey height | 3.6m |
| Acceleration | 0.8ms-2 |
| Jerk | 2ms-3 |
| Motor start up delay | 0.5s |
| Door operating times | 1.8s open, 2.9s close |
| Passenger weight | 75kg |
| Passenger transfer | 1.2s in, 1.2s out |
| Round trip time | 5% inefficiency |
Results from the authors’ computer program implementing the formulae are summarised in Table 4.
Table 4
| Capacity factor | 68% |
| Probable number of stops | 11.9 |
| Lowest reversal floor | Level 1 |
| Highest reversal floor | Level 13 |
| Interval | 26.7s |
| Figure of merit | 83% |
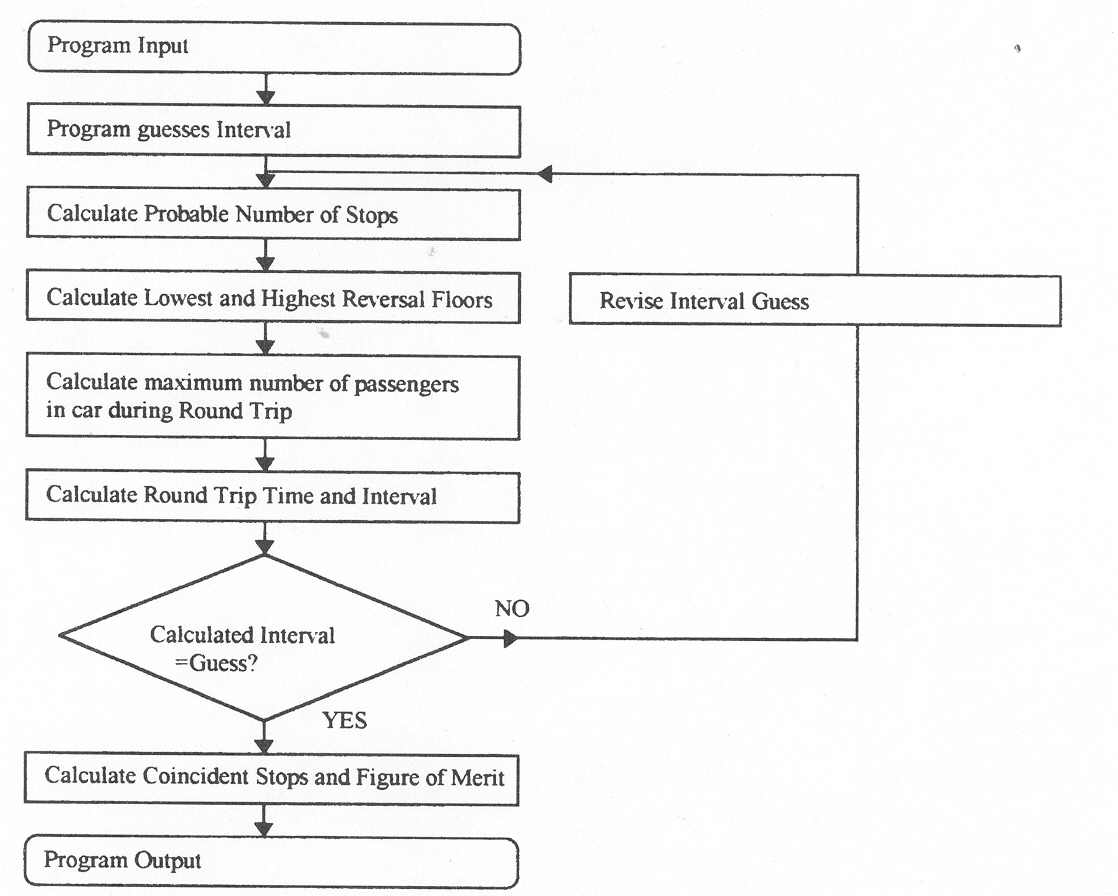
Figure 3 Calculation flow chart
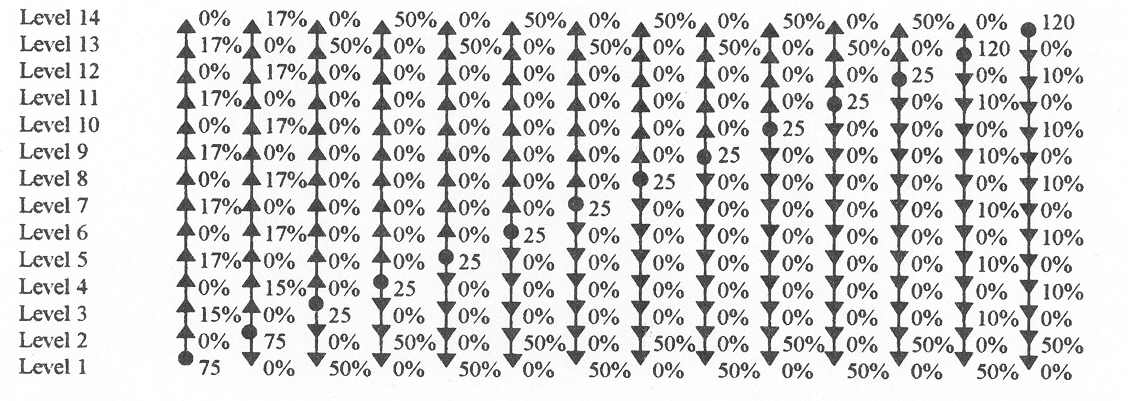
Figure 4 Complex traffic flow
10 Conclusions
The formulae presented in this paper allow analysis of any possible traffic flow for practical configuration of double deck lifts. The formulae are iterative, and for practical purposes must be implemented on a computer. A discussion of a computer program implementing the formulae and examples are given in Reference 6.
Acknowledgements
The authors would like to thank the Engineering and Physical Sciences Research Council, the Ove Arup Partnership, and the Chartered Institution of Building Services Engineers for their financial support of this research.
References
- Fortune F J Modern Double-Deck Elevator Applications and Theory Elevator Technology 6: Proc. ELEVCON ’95 pp230-238 (Stockport:IAEE)(1995)
- Strakosch GR Double-Deck Elevators: The Challenge to Utilize Space Elevator World 38(7) 50-53 (July 1990)
- Kavounas GR Elevatoring Analysis with Double Deck Elevators Elevator World 37(11) 65-72 (November 1989)
- CIBSE Guide D: Transportation Systems in Buildings (London: Chartered Institution of Building Services Engineers)(1993)
- Peters RD Lift Traffic Analysis: Formulae for the General Case Building Serv. Eng. Res. Technol.11(2) 65-67 (1990)
- Peters RD General analysis Double-Decker Lift Calculations Elevator Technology 6: Proc.ELEVCON ’95 pp165-174 (Stockport IAEE) (1995)