
Rory S. Smith
University of Northampton, UK
This paper was presented at The 4th Symposium on Lift & Escalator Technology (CIBSE Lifts Group, The University of Northampton and LEIA) (2014). This web version © Peters Research Ltd 2015.
Keywords: lifts, traffic analysis, car parking
Abstract. This paper explains and discusses under lifted buildings located in the Middle East. Three case studies are presented. Solutions or partial solutions are presented for the under lifted conditions
1. INTRODUCTION
Prior to the fall of 2008, the Middle East experienced a real estate boom of incredible proportions. In the construction frenzy prior to the bursting of the real estate bubble, many buildings were built without receiving advice from lift traffic engineers. In some cases a lift consultant was retained but his recommendations were ignored because too many lifts were recommended.
These under lifted buildings were either vacant or only partially occupied for several years. However, starting around 2013 the economy in parts of the Middle East started improving. The improvement has been particularly strong in Dubai. As the occupancy of these under lifted buildings increased, the inadequacy of the lift installations became apparent. Building owners and managers began to request help in solving the traffic handling problems in their buildings.
Three examples of under lifted buildings in Dubai are presented along with recommendations on how correct or at least improve the traffic handling inadequacies of these buildings.
2. CASE STUDY A
Building A is a multi-tenant office building located in Dubai. The building has three parking floors below the ground floor lobby, six parking floors above the lobby, and forty one office floors. The building has seven total lifts that serve all 51 stops. The 7 lifts are split into two banks. A 3 car group of panoramic lifts with a capacity of 1000kg and a speed of 2.5 m/s and a 4 car bank of conventional lifts with a capacity of 1000kg and a speed of 4 m/s.
Building A was completed prior to collapse of the real estate market in January of 2009. The building was largely unoccupied until the middle of 2012. The Dubai economy started to recover in 2012 and the population of Building A started to increase. By the beginning of 2013 the tenants were complaining about long waiting times.
Each typical floor has 696 square meters of Net Internal Area (NIA). If one assumes that Net Useable Area of this building is 80% of NIA, then each floor has a potential population of 46 persons [1].
2.1 Building A Problems
The most obvious problem was there were not enough lifts. CIBSE Guide D recommends, as a rule of thumb, 1 lift for every 3 floors [2]. 51 floors divided by 3 would suggest that 17 lifts would be required. However, only 7 were installed.
Since both groups of lifts served the same floors, passengers would place a hall call for each of the groups. Initially, passengers were placing two hall calls for each service request. Later, out of frustration, passengers would press both the up hall call and the down hall call of each group. In this way, each true hall call was accompanied by three false calls.
Each car park level is also a building entrance. Therefore, this building has 10 entrance lobbies.
Table 1 shows the impact of adding additional entrance levels to an 18 floor building with 6 lifts. Simulation software was used generate Table 1 [3]. Building A is under lifted with one entry level. However, observe the impact that additional entry levels have on waiting times and times to destination. For this reason CIBSE Guide D recommends that parking floors be served by separate lifts that do not serve office floors [2].
Table 1
| Up Peak | Lunch | |||
| AWT | ATT | AWT | ATT | |
| Lobby | 12.3 s. | 75.9 s. | 23.1 s. | 64.1 s. |
| Lobby + 1 Parking | 33.3 s. | 77.4 s. | 32.3 s. | 72 s. |
| Lobby + 2 Parking | 38.0 s. | 77.9 s. | 43.1 s. | 43.1 s. |
| Lobby + 3 Parking | 48.8 s. | 80.3 s. | 53.0 s. | 83.3 s. |
2.2 Building A Solution
For economic reasons, the control system could not be replaced. Therefore, the low cost solution for building A was to split the office floors into 2 zones. The low speed lifts would serve the lower zone and the high speed lift would serve the upper zone. Additionally, cars were assigned to specific parking floors. This reduced the number of entrance levels for each group and eliminated the possibility of registering calls to two groups. Tables 2 and 3 below demonstrate the results of this 2 bank system based on 25 persons per floor and 20% absenteeism. Please note this traffic level would represent a 54% occupancy level. Peters Research Modern Up Peak and Modern Lunch Templates, an option in simulation software were used to evaluate the proposed solution [3].
The 3 car group would serve floors B3, B2, B1, L, P1, and office floors 1 – 19.
Table 2 3 Car Group
| Up Peak | Lunch | ||
| AWT | ATT | AWT | ATT |
| 32.2 s. | 69.8 s. | 48.6s. | 67.3s |
The 4 car group serves floors L, P2, P3, P4, P5, P6, and office floors 20 – 41.
Table 3 4 Car Group
| Up Peak | Lunch | ||
| AWT | ATT | AWT | ATT |
| 29.3 s. | 73.6 s | 39.8 s. | 72.5 s. |
2.3 Building A Comments
This building simply does not have the required number of lifts to deliver good service. The modifications to the existing system greatly improved service. However, if the building occupancy reaches a level above 54%, traffic handling problems will return.
Permanent solutions could include installing additional lifts to serve the parking levels, converting the existing lifts to a multi-car system, and installing more tower lifts.
3. CASE STUDY B
Building B is a single tenant office building occupied by a builder and developer. The building was completed in 2008. The building was lightly occupied until 2013. The building has 28 floors. There are 3 parking levels below the main lobby, a ground level lobby, 5 parking levels above the lobby, and 19 office levels.
3.1 Building B Problems
Tenants were complaining of long waiting times. Waits of over 5 minutes were reported. The building was equipped with 6 lifts, each with a capacity of 1000kg and a speed of 4 m/s. All of the lifts served all of the floors. The lift control system had the Early Call Announcement feature which would illuminate a hall lantern and sound a chime immediately upon hall call registration. The car assignments were constantly being reassigned due the traffic levels in relation to the number of lifts. The constant sound of chimes and flashing hall lanterns created a high level of confusion.
The owner believed that the traffic problems were related to poor maintenance. A survey was conducted and the owner was advised that the maintenance was adequate. However the traffic problems were the result of the building being under lifted.
The building owner provided a list of the occupants on each of the occupied floors. Not all floors were occupied. However the owner anticipated that the building would achieve a 90% occupancy rate within two years.
Using the occupancy information provided by the owner, a traffic simulation was conducted using the Peters Research Modern Office Templates. The results were the following:
Worst Average Waiting Time during any 5 minute period during Up Peak: 322.0 s.
Worst Average Waiting Time during any 5 minute period during Lunch: 96.8 s.
The simulation results were consistent with the tenant observations. The system was saturating.
3.1 Building B Solutions
A four phase solution was proposed as follows:
Phase 1: Install a Destination input overlay on the 6 tower cars.
Phase 2: Modernize the 6 tower lifts using a destination input controller and a high performance door system.
Phase 3: Install 4 car park lifts with a speed of 1.7 m/s and a capacity of 1000kg.
Phase 4: Modify the tower lifts so that they do not service the car park levels.
For each of the four proposed phases, simulation software was used to model the anticipated performance of the lift systems during Up Peak and Lunch using templates from Peters Research. The results are as follows:
At completion of Phase 1:
Worst Average Waiting Time during any 5 minute period during Up Peak: 47.8 s
Worst Average Transit Time during any 5 minute period during Up Peak: 55.8 s
At completion of Phases 2, 3, and 4 with an occupancy level of 90% on all floors:
Tower Lifts Up Peak:
Worst Average Waiting Time during any 5 minute period: 34.1 s
Worst Average Transit Time during any 5 minute period: 53.1 s
Tower Lifts Lunch:
Worst Average Waiting Time during any 5 minute period: 49.4 s
Worst Average Transit Time during any 5 minute period: 45.3 s
Car Park Lifts Up Peak:
Worst Average Waiting Time during any 5 minute period: 16.2 s
Worst Average Transit Time during any 5 minute period: 27.4 s
Car Park Lifts Lunch:
Worst Average Waiting Time during any 5 minute period: 21.3 s
Worst Average Transit Time during any 5 minute period: 31.4 s
3.3 Building B Comments
Building B is another example of the need to provide separate lifts for the car park floors and for the office floors of a building.
4. CASE STUDY C
Building C is a building that was substantially completed in 2008 but was vacant until 2013. It was developed by the same firm that developed Building A. The developer was concerned that this building might have problems similar to those of Building A and asked for an analysis.
Building C is a 25 story office building. The building has 17 office floors located above a podium of 4 below ground parking levels, a ground level lobby, and 3 levels of above ground parking. The 17 office floors and 8 entrance levels were served by 5 passenger lifts each with a capacity of 1150kg and a speed of 2.5 m/s. Each of the office floors was expected to have 66 occupants when fully leased.
4.1 Building C Problems
Based on the rule of thumb that there should be one lift for every 3 floors and the suggestion that car park levels should be serviced by separate lifts, the building appeared to be under lifted.
A traffic analysis using Up Peak and Lunch templates from Peters Research was conducted. Figure 1 is a plot of the queue lengths during Up Peak.
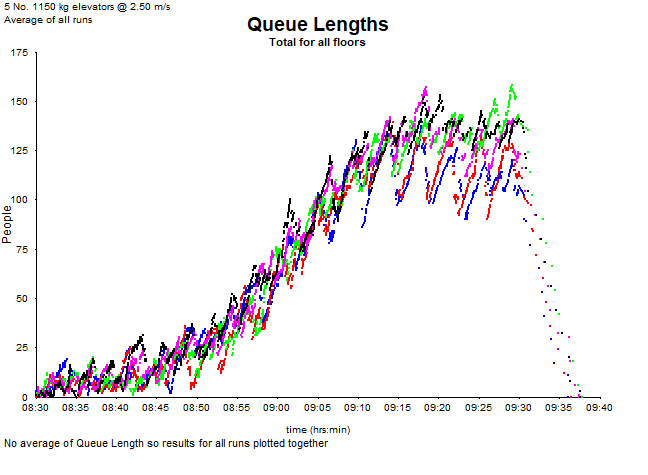
Figure 1 Queue Lengths Up Peak
Figure 2 is a plot of the queue lengths during Lunch.
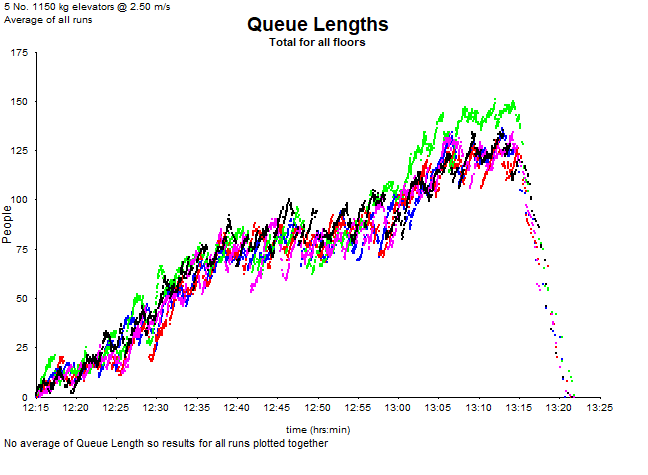
Figure 2 Queue Lengths Lunch
Figures 1 and 2 show a system that is saturated.
4.2 Building C Recommendations
The 5 lifts are fitted with a conventional group control system. A simulation using templates but based on the lifts serving only the lobby and the office floors indicated the following:
Up Peak:
Worst Average Waiting Time during any 5 minute period: 136.4 s
Worst Average Transit Time during any 5 minute period: 88.3 s
Lunch:
Worst Average Waiting Time during any 5 minute period: 64.8 s
Worst Average Transit Time during any 5 minute period: 83.8 s
The simulations were run a second time using a proprietary destination input system. The following are the results:
Up Peak:
Worst Average Waiting Time during any 5 minute period: 37.6 s
Worst Average Transit Time during any 5 minute period: 67.1 s
Lunch:
Worst Average Waiting Time during any 5 minute period: 57.5 s
Worst Average Transit Time during any 5 minute period: 57.9 s
A destination input control system was recommended for the 5 lifts. Additionally, a bank of 3 lifts was proposed to serve the car park areas.
The addition of 3 car park lifts was rejected as not being feasible for structural and economic reasons.
An alternative method of serving the car park area was proposed; Valet Parking. In Dubai, labor costs are very low in comparison to lease rates. Valet Parking could be viewed as a luxury feature whilst inexpensively solving a vertical transportation problem.
4.3 Building C Comments
Building C is another example of the need to have separate lifts for the car park floors and separate lifts for the office floors of a building. However, in this building a method that involves Valet Parking in lieu of Vertical Transportation was recommended.
5. CONCLUSIONS
Many buildings in the Middle East are built with an office tower on top of a parking podium. In most cases, the parking podium and the office floors are parking podium are served by the same lifts. Dozens if not hundreds of similar buildings will encounter traffic handling problems as their occupancy increases. This paper offers some partial remedies for these problems. The only way to achieve a good vertical transportation performance is to perform a professional traffic analysis during the design stage.
REFERENCES
- G. Barney, Elevator Traffic Handbook. London: Spon Press (2003)
- CIBSE, The Chartered Institution of Building Services Engineers Transportation Systems in Buildings, Guide D. CIBSE, Norwich (2010)
- Peters, R. (2007) ELEVATE™ Simulation Software. Mobile: Elevator World
BIOGRAPHICAL DETAILS
Rory Smith is Visiting Professor in Lift Technology at the University of Northampton. He has over 45 years of lift Industry experience and has been awarded numerous patents.