
Lutfi Al-Sharif2,3, Stefan Gerstenmeyer1, Jens Niebling1, Richard Peters2, Maria Abbi2
1thyssenkrupp Elevator, 2Peters Research Ltd., 3The University of Jordan
This paper was presented at The 10th Symposium on Lift & Escalator Technology (CIBSE Lifts Group, The University of Northampton and LEIA) (2019). This web version © Peters Research Ltd 2019
Keywords: Monte Carlo Simulation; probability density function; cumulative distribution function; car capacity; car-load; lift traffic analysis; lift traffic analysis.
Abstract. The Monte Carlo Simulation (MCS) method has been successfully applied in lift traffic systems to evaluate a number of different parameters such as the round-trip time and the average travelling time; and under different conditions, such as sectoring control and for multiple lift cars running in the same shaft. Using the MCS methods is particularly effective in cases where the number of possible combinations becomes too complicated for analytical equation-based calculation methods to deal with.
This paper attempts to extend the applications of the MCS method in two areas: Car capacity and drive-motor system sizing. It uses this method to compile the probability density functions (PDF).
In the first area, MCS is used in order to compile the statistical description of the number of passengers in the lift car whenever it departs from a floor. This is concisely presented in the form of a PDF of the number of passengers in the car when it departs from a floor. Such a PDF can be used to make judicious decisions regarding the suitable car capacity.
The second area involves using the same data in order to compile a load profile of the number of passengers inside the lift car when it stops at a certain floor and when it departs from the that floor, along with the probability of the lift car stopping at that floor. This provides a strong input to simulate the drive-motor system and evaluate the temperature rise in the windings and the power electronic devices.
A numerical example is given for a single lift car to illustrate the application of the method.
1. Introduction
The Monte Carlo Simulation method has been successfully used in a number of applications in lift traffic analysis and design, such as the evaluation of the round-trip time under conventional group control [1], the average travelling time [2], evaluating the round-trip time for double decker lifts [3], evaluating the round-trip time under sectored group control [4, 5], in multi-car lift systems [6] and other applications [7, 8]. The MCS method is effectively one of the calculation methods employed in lift traffic engineering.
At the heart of the MCS method is the generation of representative passenger traffic that reflects the prevailing traffic in the building. The prevailing traffic conditions are one of the most important elements of lift traffic demand [9].
Based on the expected mix of traffic, the so-called origin-destination (OD) matrix can be developed that concisely describes the probability of a passenger travelling from one floor in the building to another floor. Well established procedures have been developed that allow the compilation of an OD matrix from the floor population percentages, the entrance bias and the mix of prevailing traffic [10, 11]. A more generalised procedure that allows any floor to simultaneously be an entrance floor and an occupant floor has been recently published [12]. Research has also been carried out on the reverse procedure (i.e., estimating the traffic mix from the lift movements resulting from passenger origin-destination pairs) as shown in [13, 14, 15, 16].
The most important application of the OD matrix is in the random generation of passenger origin-destination pairs within simulation software packages or for the purposes of MCS. The full procedure is clearly documented in [17] as an integrated framework. When using the MCS methods to simulate a full round-trip, a number of passengers, denoted as P passengers, are generated (denoted as Pgen). Generating a passenger in this context involves finding the origin-destination pair for that passenger.
It is also possible to generate random arrival times for passengers (i.e., generating passengers in time) assuming a Poisson passenger arrival process [18]. However, this is beyond the scope of this paper. Potentially, this could further affect that probability density function (PDF) as the additional randomness of the arrival time of the passengers is considered (i.e., too many passengers arriving in a period of time, or too few).
In this paper, the MCS method is used in order to develop a detailed description of the car-load in the lift car at every start or within the whole round-trip under conventional group control but assuming general traffic conditions. As the car-load is a random variable (especially under general traffic conditions) then it is best described as a probability density function (PDF). The advantage of describing the car-load in the car in consecutive round-trips, using a PDF, is that it is possible to understand the scatter of the values of the car load in units of passengers and then make an informed decision on the car capacity (CC).
A similar comment can be made regarding the sizing of the drive system. A detailed understanding of the load inside the car at different positions in the shaft, can help the designer make an informed assessment of the temperature of the electrical drive system and the traction motor.
When the prevailing traffic is incoming traffic (e.g., 100% incoming traffic), the car-load is obviously equal to the number of generated passengers in a round-trip (Pgen). However, under general traffic conditions, the prevailing traffic could be any mixture of incoming traffic, outgoing traffic, inter-floor traffic and even inter-entrance traffic. Under these conditions, the effective car-load would be smaller than the number of generated passenger (Pgen) and this presents an opportunity to increase the handling capacity of the lift system.
It is worth noting that the definition of the type of traffic as incoming, outgoing, inter-floor or inter-entrance assumes that any floor can be classified as either an entrance/exit floor or an occupant floor, although the procedure followed in this paper has made the simplifying assumption that any floor is either an occupant floor or an entrance/exit floor.
Section 2 discusses the motivation for developing this paper. The random nature of the passenger generation process is discussed in Section 3. Section 4 reviews in detail the procedure for preparing the cumulative distribution function (CDF) from the probability density function (PDF) and then using it to randomly generate passenger journey origin-destination pairs. A detailed numerical scenario is analysed in Section 5. Section 6 contains some PDF results for the car loading and the drive loading at different floors (up and down). Conclusions are drawn in Section 7.
2. Motivation for this paper
It has been noted that the car capacity is not fully exploited when the traffic is not fully incoming or not fully outgoing. A good example of this problem can be seen under the following conditions: The maximum car capacity is 8 persons, the traffic is 50% incoming and 50% outgoing, and 8 passengers are generated per round-trip. Under these conditions, on average, 4 passengers travel in the up direction and 4 passengers travel in the down direction.
It is recognised that as the traffic mix becomes more balanced between incoming traffic and outgoing traffic, an opportunity exists to exploit this balance by increasing the number of passengers generated in one round-trip
The question that this exercise answers is formulated below:
“When the traffic in the building is not purely incoming or purely outgoing, but a mix of different modes (i.e., incoming, outgoing, inter-floor, inter-entrance), what is the effective car load in a consecutive round-trip, and the effective car load every time it starts and what is the car load inside the car at different positions in the shaft?”
Answering the first part of the question helps the designer decide on the suitable car capacity for a certain mix of traffic. Ultimately, it could allow the designer to keep the car capacity at its value but scientifically deal with larger handling capacities under balanced mixes of traffic.
3. An important note on the random nature of the passenger generation process
When expressing the car-load, the term ‘on average’ is used here, because the passenger generation process is truly random. For example, if 8 passengers are to be generated in one round trip and the traffic is exactly balanced between incoming traffic and outgoing traffic, the 8 passengers are generated randomly, and it could be that 5 of them are incoming passengers and 3 of them are outgoing passengers in one round trip. Under certain rare round-trip scenarios, the random generation of passengers could result in 7 incoming passengers and one outgoing passenger, or even (in rare cases) 8 incoming passengers and no outgoing passengers or 8 outgoing passengers and no incoming passengers.
However, after generating a very large number of round-trip passengers, the average of the number of incoming passengers will approach 4 passengers and the number of outgoing passengers will also approach 4 passengers.
This random generation of passenger origins and destinations ensures that the final value of the round-trip time is a faithful representation of the true value for the round-trip time as it better represents the real-life conditions of random passenger movements. The value of the round-trip time obtained at the end represents all of the possible combination, and more importantly, in the correct ratio.
4. Generating the passenger origin-destination pairs from the CDF
As discussed in Section 1, the passenger origin-destination pairs should be representative of the traffic in the building. This is done in accordance with a systematic methodology that uses the origin-destination (OD) matrix. The systematic method involves the following steps:
1. Obtaining the nature of the floors in the building as follows:
a) Whether a floor is an occupant floor, an exit/entrance floor or both.
b) The percentage of passenger arrivals/departures from an entrance/exit floors (sometimes referred to as “entrance bias”).
c) The ratio of the populations of the occupant floor (the actual number is not required; simply the relative strength).
d) The mix of traffic, expressed as percentages of decimal fractions adding up to 1, as follows: incoming traffic, outgoing traffic, inter-floor traffic and inter-entrance traffic.
2. Building the OD matrix.
3. Converting the origin-destination from a PDF to a CDF by integration. An example of a CDF for the building used as an example in this paper is shown in Figure 1. This building has 8 occupant floors with equal populations and 2 entrance floors with ratio of 30%:70% for the basement and the ground respectively. The traffic mix is representative of lunchtime traffic (45% incoming: 45% outgoing: 10% inter-floor).
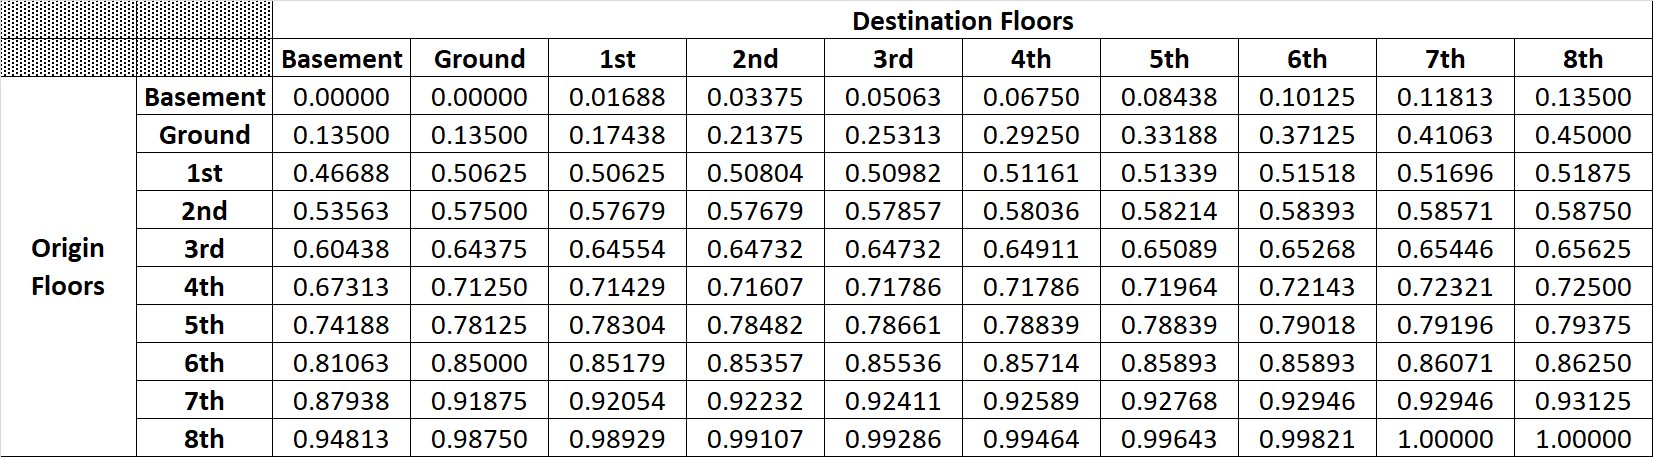
Figure 1: Cumulative Distribution Function (CDF) for the passenger origin-destination pairs.
4. Carrying out random sampling in order to generate the origin-destination pairs. The random sampling consists of generating uniformly distributed random numbers between 0 and 1 and applying them to the CDF produced in the previous step (shown in Figure 1).
5. Sorting the origins and destinations into the up-part of the round-trip and the down-part of the round-trip.
6. Finding the stops during the round-trip.
7. Calculating the number of passengers in the lift car when it departs from the floor at which a stop occurred. This number represents the load inside the lift car.
8. The largest number of passengers inside the car during the round-trip will be taken as representative of the maximum car-load for a round-trip. This value is stored in an array. In addition, a note is taken of all the values of the numbers of passengers inside the car when it started at each floor.
9. Steps 4 to 8 are repeated for a large number of times (the number of trials in the Monte Carlo Simulation, e.g., 10,000 trials).
10. The values of the car loading from each of the ‘n’ trials are then analysed in order to produce a PDF for the maximum car loading in a round-trip, the load in the car when it starts at each floor.
It is worth noting that when looking at the number of passengers inside the car, the assumption is that passengers inside the car will alight first and then waiting passengers at the landing will board. This is more representative of reality. By taking the number of passengers inside the car, when it departs from a floor at which a stop occurred (as suggested in point 7 above), ensures that this is the case.
5. Numerical examples/scenarios
As an example, on the above, taking a lift with a car capacity of 9 passengers and assuming that the passengers will be willing to fill it up with 9 passengers where possible. It will be insightful to examine the following two different cases:
The first case is pure incoming traffic (i.e., 100% incoming traffic: 0% outgoing traffic: 0% inter-floor traffic). As the building has two contiguous entrances, then the 9 passengers will originate at one of the two entrance floors (basement and ground in this case). Thus, as the lift car departs from the ground floor, it will have 9 passengers on board, regardless of the origins or destinations of the passengers. Therefore the lift car will fill up to its maximum capacity in every round-trip. There is nothing to be gained from analysing the various random scenarios, as the car will fill up with 9 passengers in every round-trip.
An alternative scenario is where the traffic in the building is mixed (e.g., lunchtime traffic: 45% incoming: 45% outgoing: 10% inter-floor). In this case, the maximum load in the car will vary from one round-trip to the next and will rarely attain the value of 9 passengers.
Table 1: The origins and destinations of the 9 passengers.
| Passenger # | Origin floor | Destination floor | Type of Passenger |
| P1 | 3 | 2 | Inter-floor |
| P2 | G | 5 | Incoming |
| P3 | B | 3 | Incoming |
| P4 | 8 | 6 | Inter-floor |
| P5 | 7 | G | Outgoing |
| P6 | 1 | 7 | Inter-floor |
| P7 | 4 | B | Outgoing |
| P8 | G | 5 | Incoming |
| P9 | 5 | 8 | Inter-floor |
As can be seen in the table, there are 4 inter-floor passengers, 2 outgoing passengers and 3 incoming passengers. The full journey is now analysed in terms of stops and passengers in the car throughout the round-trip as shown in Table 2.
Table 2: Analysis of one full round-trip to obtain car loading.
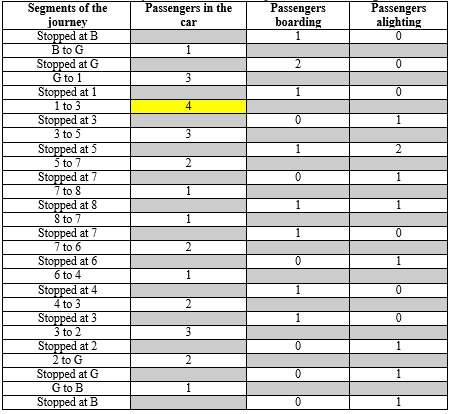
The same round-trip analysis is also shown in a diagrammatic format in Figure 2.
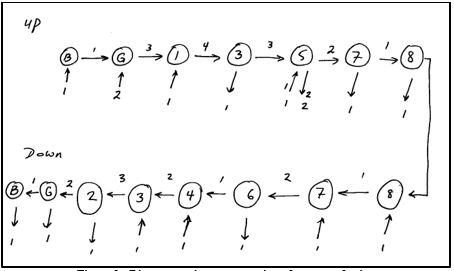
Figure 2: Diagrammatic representation of one round-trip.
When examining the load inside the car at the moment it starts at every stop, there are cases when the car starts with zero passengers inside. The probability density function for the number of passengers inside the car when it starts could either include 0, 1, 2, 3…. passengers or 1, 2, 3, …. passengers. It has been decided to exclude the case where there are no passengers inside the car, as this does not contain any meaningful data. Thus, the probability density function has random variable values running from 1 to P (and does not include 0).
6. Results
In this section, a sample of the results that are obtained from the MATLAB software are reviewed.
A sample building that has 8 occupant floors above ground and two entrance floors (basement, ground) is used. It is assumed that the occupant floors have equal populations. It is worth noting that the software does not require the actual floor population; it simply needs the ratio of the floor populations. The software also needs the entrance bias for the two entrance floors (in this case assumed to be 30%:70% for the basement passenger arrival rates). The traffic mix is assumed to be a typical lunchtime traffic (45% incoming: 45% outgoing: 10% inter-floor).
The Monte Carlo Simulation was run for 1000 trials, with 8 passengers generated in each round-trip. The number of passengers in the car at every start at each floor was recorded to be later processed. The data was then processed to produce the following:
- The number of passengers inside the car when it starts. This was then converted to a probability density function (PDF). The resulting PDF is shown in Figure 3.
- The maximum number of passengers in the car during a round-trip. This was then converted to a PDF. The resulting PDF is shown in Figure 4.
- The number of passengers inside the car when it starts at each floor. A distinction is made between the start at a floor in the up direction and the down direction. This is compiled into an average load inside the car when it starts in a certain direction. This is shown in a tabular format in Figure 5. It is worth noting that the four cells highlighted in yellow have zero values in them. As expected, the car cannot start at the topmost floor when travelling in the up direction, and it cannot stop at the lowest-most floor when travelling in the up direction. A similar argument applies when travelling in the down direction.
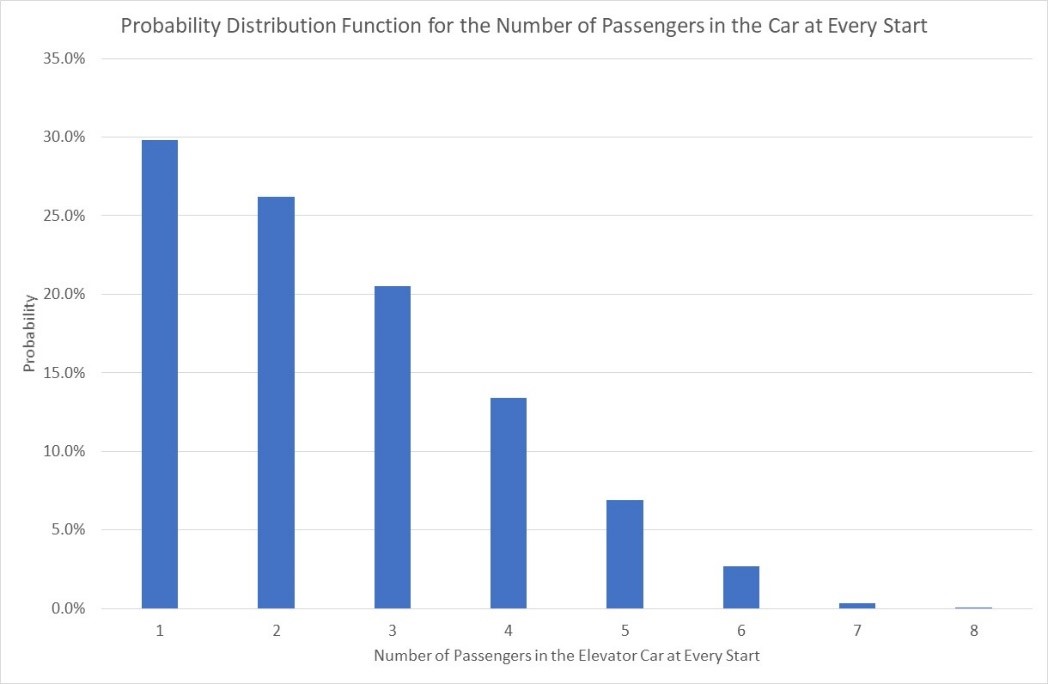
Figure 3: The PDF results for the number of passengers inside the car at every start, in units of passengers and at a lunchtime traffic (45% incoming: 45% outgoing: 10% inter-floor).
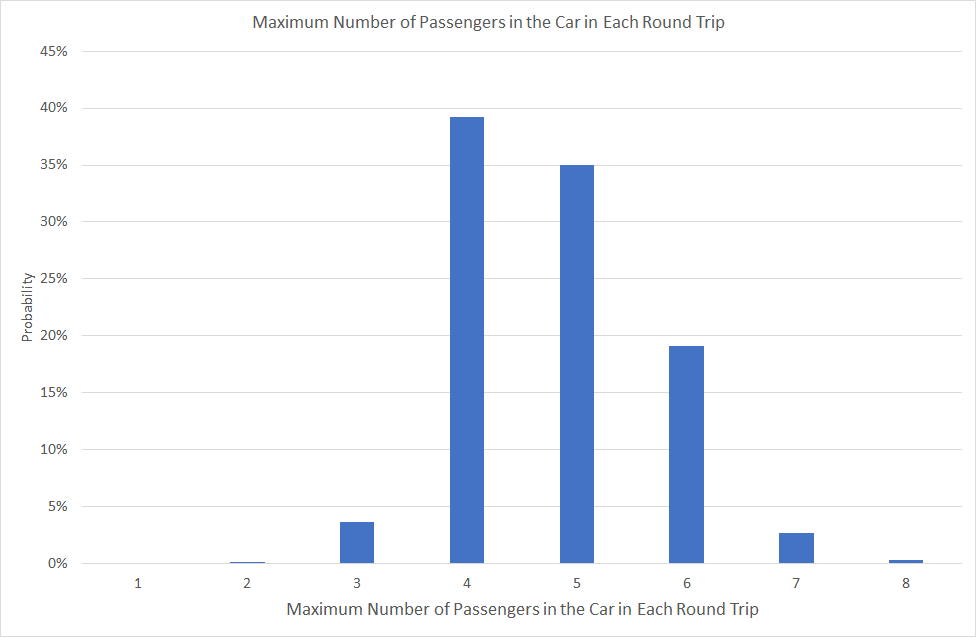
Figure 4: The PDF results for the maximum car-load for 8 generated passengers in a round-trip and lunchtime traffic (45% incoming: 45% outgoing: 10% inter-floor).
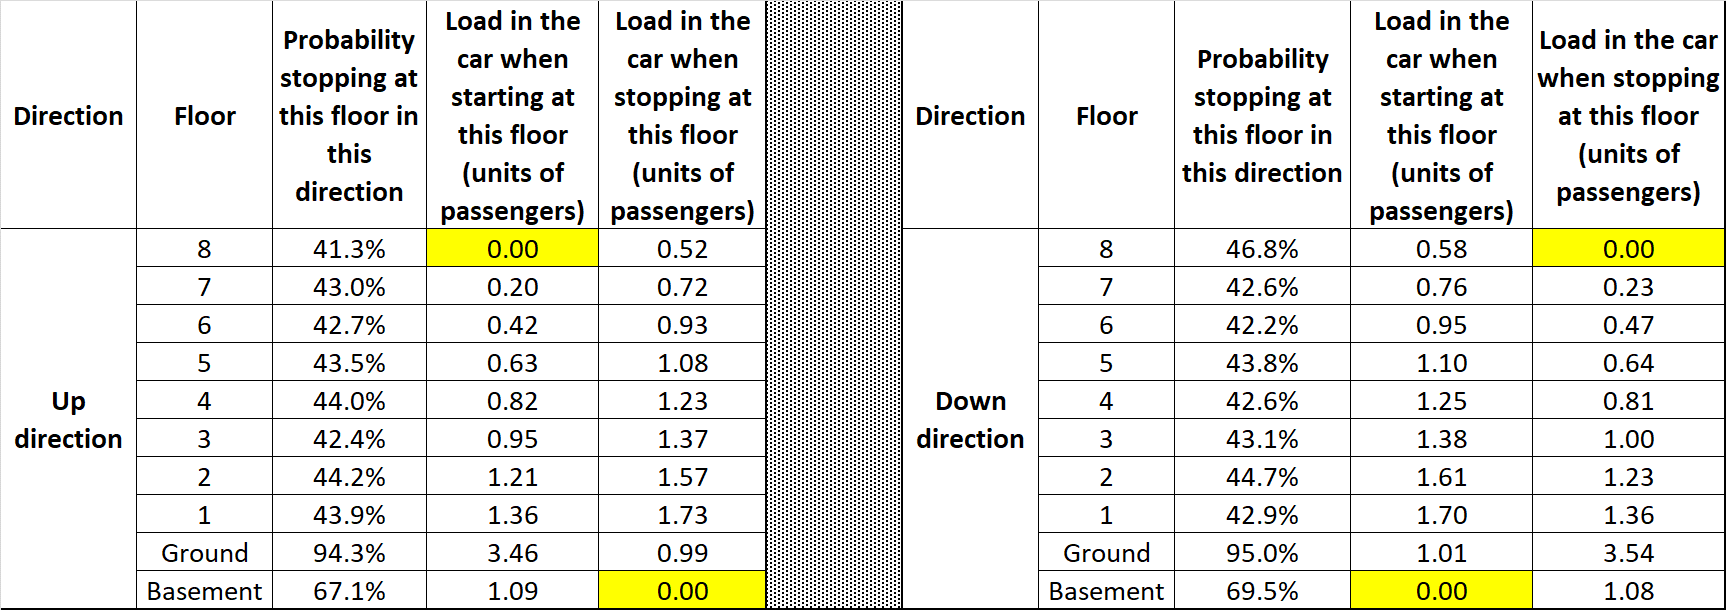
Figure 5: The Drive Load results for 8 passengers in a round-trip and lunchtime traffic (45% incoming: 45% outgoing traffic: 10% inter-floor traffic).
7. Conclusions
The Monte Carlo Simulation method has been successfully used in order to extract the load inside the car when it started at each floor and the maximum car-load in the lift car under general traffic conditions. This relied heavily on the origin-destination matrix probability density function (PDF) which was converted into a cumulative distribution function (CDF) and then used to randomly sample passenger origin-destination pairs.
Over a large number of Monte Carlo Simulations, the values of the car-load at each start was stored. The values were then processed to obtain the car-load when it starts, the maximum car-load in a round-trip and the average car-load at each floor in both directions. The results were then compiled into appropriate PDFs and an average load in the car at each floor table.
The results can be used to assess the suitable car capacity under mixed traffic conditions. They can also be used to simulate and model the thermal performance of the drive system and the traction motor.
REFERENCES
- Al-Sharif L, Aldahiyat H M and Alkurdi L M. The use of Monte Carlo simulation in evaluating the elevator round trip time under up-peak traffic conditions and conventional group control. Building Services Engineering Research and Technology 2012; 33(3): 319–338. doi:10.1177/0143624411414837.
- Al-Sharif L, Abdel Aal O F and Abu Alqumsan A M. Evaluating the Elevator Passenger Average Travelling Time under Incoming Traffic Conditions using Analytical Formulae and the Monte Carlo Method. Elevator World 2013; 61(6): 110-123. June 2013.
- Al-Sharif L, AlOsta E, Abualhomos N and Suhweil Y. Derivation and Verification of the Round Trip Time Equation and Two Performance Coefficients for Double Deck Elevators under Incoming Traffic Conditions. Building Services Engineering Research and Technology 2017; 38(2): 176-196.
- Al-Sharif L, Jaber Z, Hamdan J and Riyal A. Evaluating the performance of elevator group control algorithms using a three element new paradigm. Building Services Engineering Research and Technology 2016; 37(5): 597–613. 10.1177/0143624416652182.
- Al-Sharif L, Yang Z S, Hakam A and Abd Al-Raheem A. Comprehensive analysis of elevator static sectoring control systems using Monte Carlo simulation. Building Serv. Eng. Res. Technol. 2018; DOI: 10.1177/0143624417752644
- Gerstenmeyer S. Traffic Analysis for a Multi Car Lift System Used as Local Group. Proceedings of the 9th Symposium of Lift and Escalator Technologies, September 2018, The University of Northampton, United Kingdom, 23.1 – 23.10
- Powell B. The role of computer simulation in the development of a new elevator product. Proceedings of the 1984 Winter Simulation Conference, page 445-450, November 1984, Dallas, TX, USA, published by INFORMS, Catonsville, MD 21228, United States.
- Tam C M and Chan A P C. Determining free elevator parking policy using Monte Carlo simulation. International Journal of Elevator Engineering 1996; 1:24-34.
- Al-Sharif L. Introduction and Assessing Demand in Elevator Traffic Systems (METE I). Lift Report 2014; 40(4): 16-24. July/August 2014.
- Al-Sharif L and Abu Alqumsan A M. Generating the Elevator Origin-Destination Matrix from the User Requirements Specification under General Traffic Conditions. Elevator Technology 2016; 21: 1-13. Proceedings of Elevcon 2016. Madrid/Spain: The International Association of Elevator Engineers.
- Al-Sharif L. Building the Origin-Destination Matrix under General Traffic Conditions and Using it to Generate Passenger Origin-Destination Pairs (METE XII). Lift Report 2016; 42(3):24-33.
- Al-Sharif L. The Universal Origin-Destination-Matrix with Dual Designation Floors as Entrances and Occupant Floors. Lift Report 2018; 44(2):36-45.
- Basagoiti R, Beamurgia M, Peters R and Kaczmarczyk S. Origin destination matrix estimation and prediction in vertical transportation. 2nd Symposium on Lift and Escalator Technologies, University of Northampton, Northampton, U.K., 27th September 2012.
- Basagoiti R, Beamurgia M, Peters R and Kaczmarczyk S. Passenger flow pattern learning based on trip counting in lift systems combined with on-line information. 3rd Symposium on Lift and Escalator Technologies, University of Northampton, Northampton, U.K., 26th – 27th September 2013.
- Kuusinen J M, Sorsa J, Siikonen M L. The elevator trip origin-destination matrix estimation problem. Transportation Science, 2015; 49(3): 1-18.
- Kuusinen J M, Malapert A. The effect of randomisation on constraint based estimation of elevator trip origin-destination matrices. 4th Symposium on Lift and Escalator Technologies, University of Northampton, 25th to 26th September 2014.
- Al-Sharif L and Abu Alqumsan A M. An Integrated Framework for Elevator Traffic Design under General Traffic Conditions Using Origin Destination Matrices, Virtual Interval and the Monte Carlo Simulation Method. Building Services Engineering Research and Technology 2015; 36(6): 728-750.
- Al-Sharif L. Generating Elevator Passengers in Time (METE XIII). Lift Report 2017; 43(3): 21-31.
BIOGRAPHICAL DETAILS
Lutfi Al-Sharif is currently professor of building transportation systems at the Mechatronics Engineering Department at the University of Jordan, Amman, Jordan. His research interests include elevator traffic analysis and design, elevator and escalator energy modelling and simulation and engineering education. He is also a visiting professor at the University of Northampton and a Consultant at Peters Research Ltd.
Stefan Gerstenmeyer has many years of experience in R&D for lift controls, group and dispatcher functions/algorithms, including traffic analysis and multi car lift systems. He is working as Chief Engineer/Head of Traffic and Group Control at thyssenkrupp Elevator. He has a degree in information technology and a PhD in Engineering from the University of Northampton.
Jens Niebling holds a degree in electrical engineering and is currently a software engineer with thyssenkrupp. He is part of the team working on traffic concepts for MULTI. He also has several years of experience in the development of frequency converters.
Richard Peters has a degree in Electrical Engineering and a Doctorate for research in Vertical Transportation. He is a director of Peters Research Ltd and a Visiting Professor at the University of Northampton. He has been awarded Fellowship of the Institution of Engineering and Technology, and of the Chartered Institution of Building Services Engineers. Dr Peters is the author of Elevate, elevator traffic analysis and simulation software.
Maria Abbi is a Research Assistant at Peters Research Ltd on a gap year placement having studied Maths, Further Maths, Physics and Chemistry at Wycombe High School. She is currently studying a course in Aeronautical Engineering at Imperial College London in September 2018.