
Dr Richard D Peters, Peters Research Ltd.
This paper was presented at Symposium of Lift and Escalator Technologies, 2012. This web version © Peters Research Ltd 2012.
Abstract
Performance time is a measure of how long it takes for a lift to travel between two floors, including opening and closing of the doors. Performance time has a major effect on handling capacity and passenger waiting times. Performance time can be modelled in traffic analysis and simulation through the application of lift kinematics. Formulae can be used to calculate travel times and to plot the distance travelled, velocity, acceleration and jerk against time. Measurements of these parameters can be derived from accelerometer readings. Measurements of start and levelling delays are more difficult to make, but are necessary to model a lift trip completely. Site measurements and ideal lift kinematics are plotted together for comparison. Performance time assumptions typically made in lift traffic analysis and simulation are compared with site measurements. The difference between assumed performance times and measurement are considered in the context of their impact on handling capacity and waiting times. Proposals are made which help designers to avoid discrepancies compromising the traffic design.
List of symbols
| a | Acceleration (m/s2) |
| d | Lift trip distance (d) |
| j | Jerk (m/s3) |
| T | Performance time (s) |
| T(d) | Performance time for flight distance d (s) |
| ta | Advanced door opening time (s) |
| tc | Door closing time (s) |
| tf(1) | Single door flight time (s) |
| tf(d) | flight time for travel distance d (s) |
| to | Door opening time (s) |
| tsd | Start delay time (s) |
| v | Rated speed (m/s) |
Introduction
For traffic analysis and simulation results to be realistic, we need to base our calculations on achievable performance times, specify the required performance in tender documents, and measure the installation to ensure that the necessary performance is being delivered.
In the 1960’s and 70’s a major lift company had a definition for performance time, “start of doors close to doors three quarters open on the next floor”. For a floor to floor height of 3.5 to 4m, a time of less than 9 seconds was expected for a high performance lift. CIBSE Guide D Transportation Systems in Buildings Section 3 (1) breaks performance time into five components:
T = tf(1) + tsd + tc + to – ta (1)
In the Elevator Traffic Handbook (2), Barney defines the door opening time as “a period of time measured from the instant that the car doors start to open until they are open 800 mm”. Like Otis, Barney recognises that in traffic analysis, from the passenger’s prospective, the passengers can start loading and alighting lifts before the doors are fully open.
The performance time as described above gives a good overall picture of lift performance and can be measured simply with a stop watch. However, its limitations are:
- The performance time of the same equipment will be different according to floor height.
- The performance time cannot be applied in simulation as the travel time for two floors is not twice the travel time for a single floor.
To overcome these limitations, we need to make accelerometer measurements and to apply an understanding of lift kinematics.
Lift Kinematics
Lift kinematics is “the study of the motion of a lift car in a shaft without reference to mass or force”. We are studying how the lift moves and not, for example the implications of the car size on the lift motor.
The time it takes for a lift to travel between two floors is limited by the rated speed, acceleration and jerk. The jerk is rate of change of acceleration, i.e. when a lift accelerates is does not accelerate at the same rate all the time, it takes time to build up and down to the rated acceleration.
Humans are sensitive to acceleration and jerk and can feel discomfort if either is too high. We are not sensitive to lift speed, except in very high speed lifts where the change in atmospheric pressure, particularly during descent, can cause discomfort.
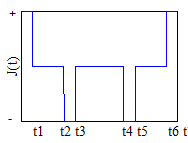
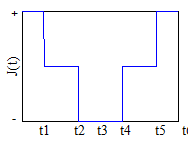
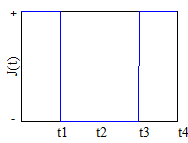
Formulae can be derived (3) to plot distance, velocity, acceleration and jerk against time. Microprocessor controlled variable speed drives can be programmed to match these profiles very closely. The plots look different depending on the trip; options A, B and C as shown in Figure 1.
For option A, the lift reaches full speed, travels at this speed for some time and then slows down again. The plots are typical for a lift which is travelling several floors.
For option B, the lift does not actually reach full speed. The plots are typical for a high speed lift travelling one floor; there is insufficient time to reach the rated speed before the car needs to start slowing down again.
For option C, the lift does not even have time to reach full acceleration. This is representative of a re-levelling operation, so would not normally be seen in lift performance measurements.
t t t
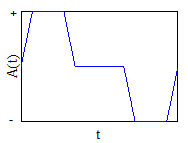
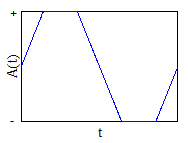
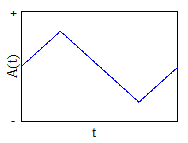
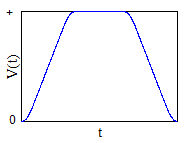
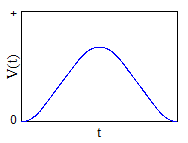
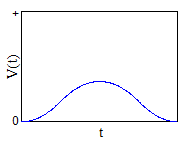
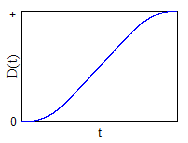
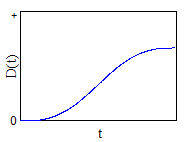
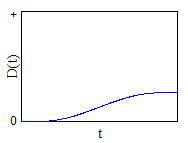
Figure 1 Ideal lift kinematics for: (A) lift reaches full speed; (B) lift reaches full acceleration, but not full speed; (C) lift does not reach full speed or acceleration
Measuring Lift Performance
Equipment
There are a number of lift performance tools which will help measure lift velocity, acceleration and jerk (4) (5). Measuring start delay and advanced door opening is more difficult, so we have developed our own performance tool (6) which integrates accelerometer and time measurements, then uses software algorithms to interpret these measurements directly.
Measuring procedure
With the accelerometer placed on the lift car floor the measurement points are triggered when the:
- doors start closing at floor
- doors are fully closed
- doors start opening at destination floor
- doors fully open at destination floor.
The accelerometer is taking measurements continuously for the whole period so, for example, we can calculate the start delay as the software knows both when the doors have closed, and when the car starts moving.
General observations
Note that we have chosen to measure door time until the doors are fully open rather than three quarters or 800 mm open. This gives us enhanced, although more complex options to improve our modelling of door dwell times and passenger transfer times. Currently where passenger transfer occurs while the doors are still opening we would reflect this in passenger transfer time assumptions and calculations.
In some installations the car doors finish closing shortly after the landing doors. Our measurement for door close time ends when the car doors are fully closed. At the instant the car doors are fully closed we start our measurement of start delay. A valid observation is that if the car doors finish closing after the landing doors, it is easier to get a low start delay as the landing door interlocks are made before the end of the door close time. This delayed car door closing has been observed in the installations where we have observed zero motor start delay. To minimise start delay, some equipment pre-torques the motor and lifts the break before the doors are fully closed.
Ride comfort has become more important in recent years. This has resulted in the use of lower accelerations in some high rise buildings with high speed lifts; requirements are subjective and sensitive to culture. At the economy end of the market, some very low values of acceleration have been measured. This is probably because lower accelerations require less torque, so smaller lift motors can be used.
Processing measurements
As all accelerometer measurements have signal noise, the acceleration reported will depend on how you filter the signal. However, for performance (rather than comfort) analysis, we want to model the trip as accurately as we can with lift kinematic formulae. So, our approach is to best fit the idealised measurement to the idealised kinematic plots, see Figure 2. In this example the maximum acceleration is 0.95 m/s, but the acceleration using best fit is 0.81 m/s². This second value gives us the most accurate input for modelling the lift in simulation.
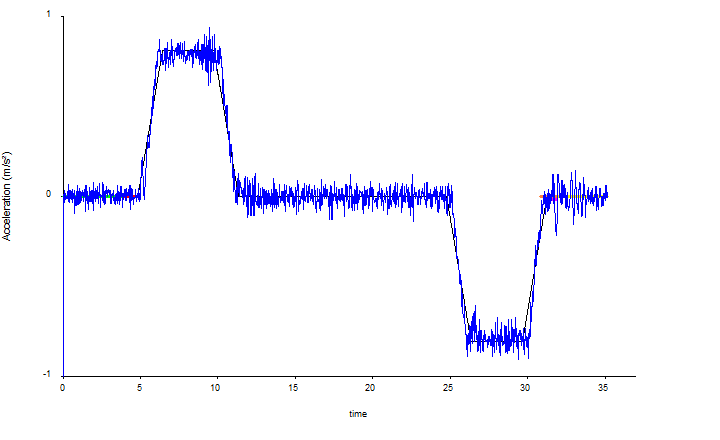
Figure 2 Measured and ideal acceleration
By differentiating the acceleration measurements we can determine jerk, see Figure 3.
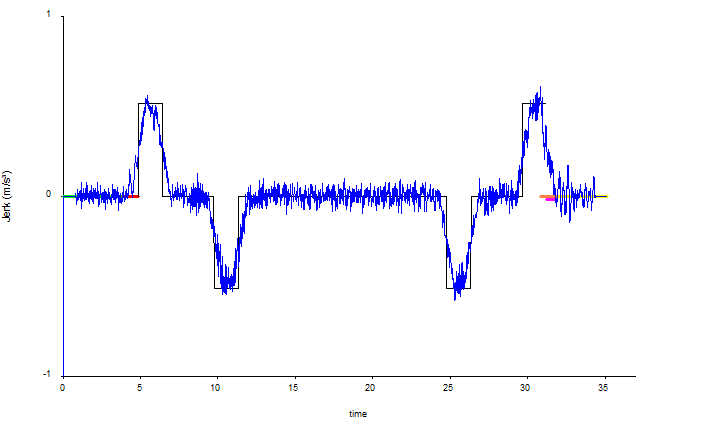
Figure 3 Measured and ideal jerk
Integrating the acceleration gives us the velocity, see Figure 4.
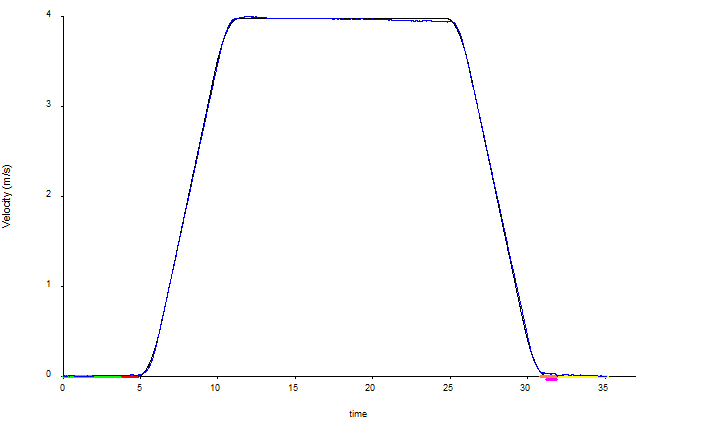
Figure 4 Measured and ideal velocity
Finally, integrating the velocity provides the distance travelled, see Figure 5.
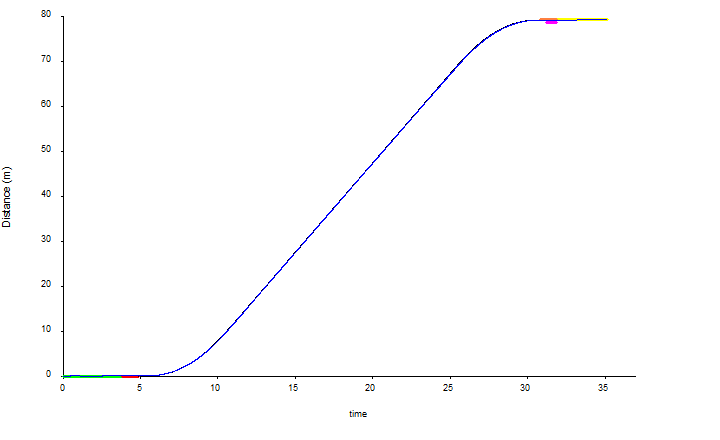
Figure 5 Measured and ideal distance travelled
Calibration of the accelerometer can be confirmed by comparing the measured and actual distance travelled.
Door closing time and start delay are overprinted on the start of the plots, see Figure 6.
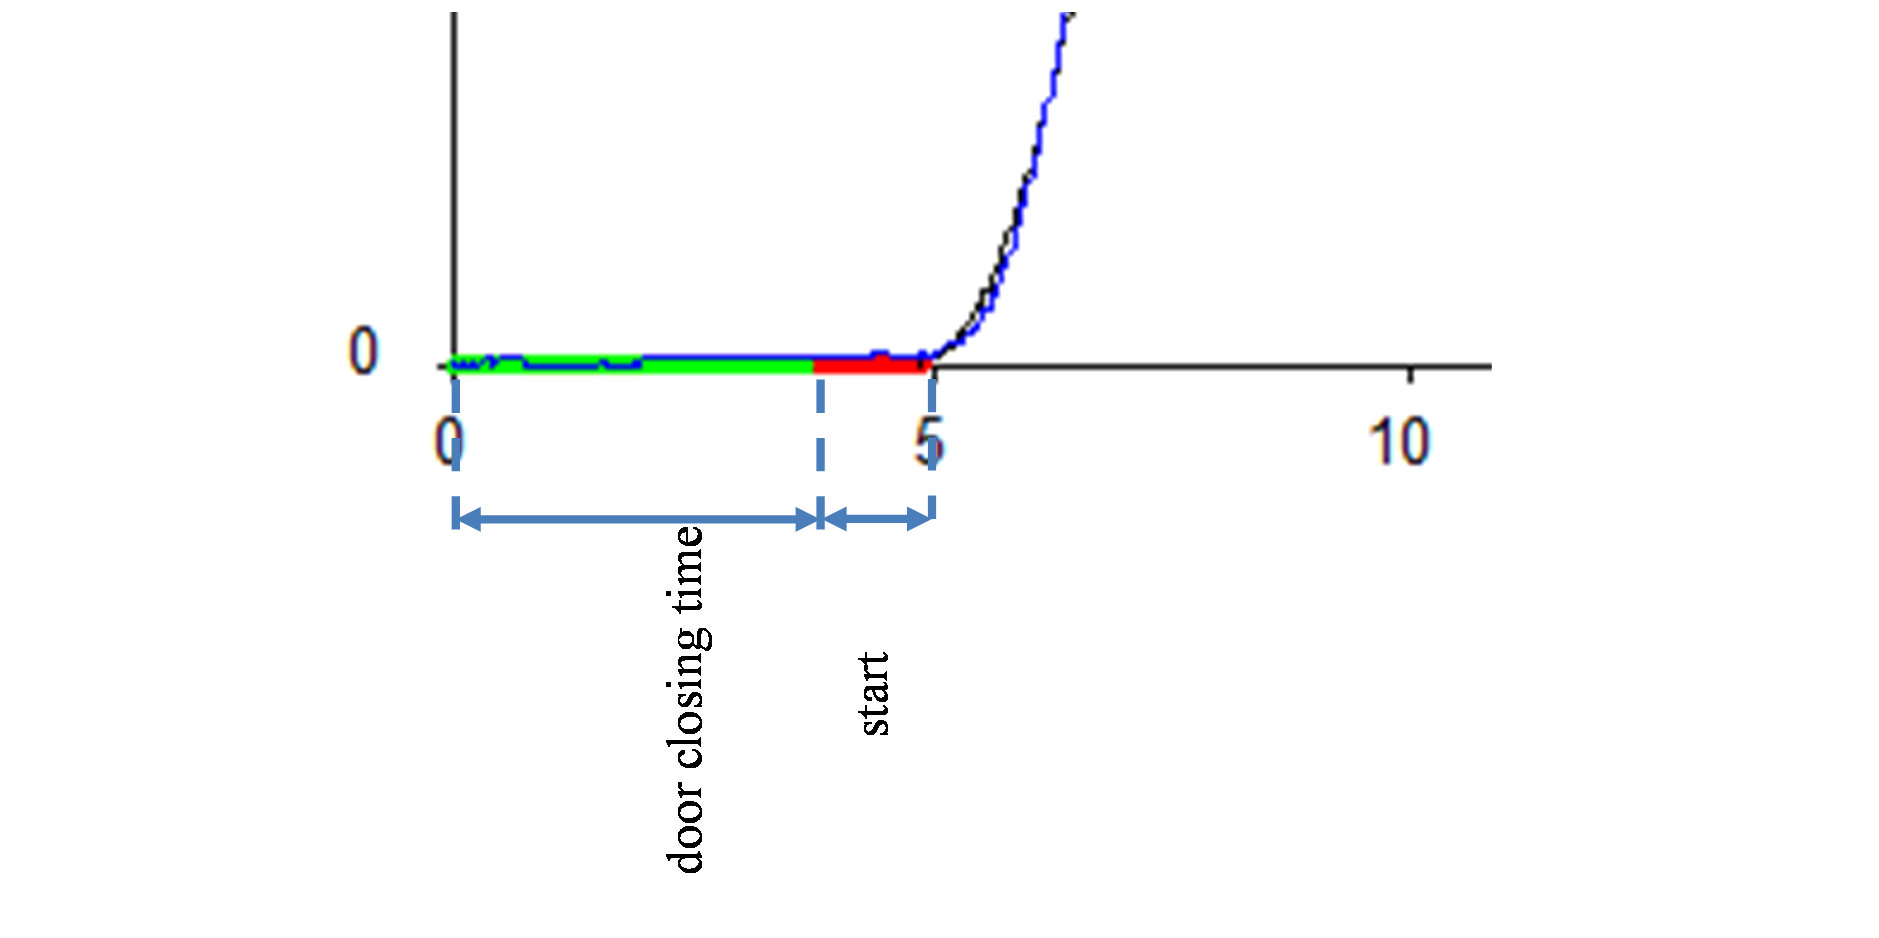
Figure 6 Close up of start of velocity plot showing door closing time and start delay
Although modern drives normally allow lifts to travel directly into the floor, we have measured a number of installations where there is a significant levelling time. The combination of acceleration and time measurements allow the software to determine when the doors start opening relative to when the car stops. Figure 7 provides a close up on the end of the velocity plot. Note the levelling delay and door opening time overlap; in this installation part of the levelling delay is compensated for by advance door opening.
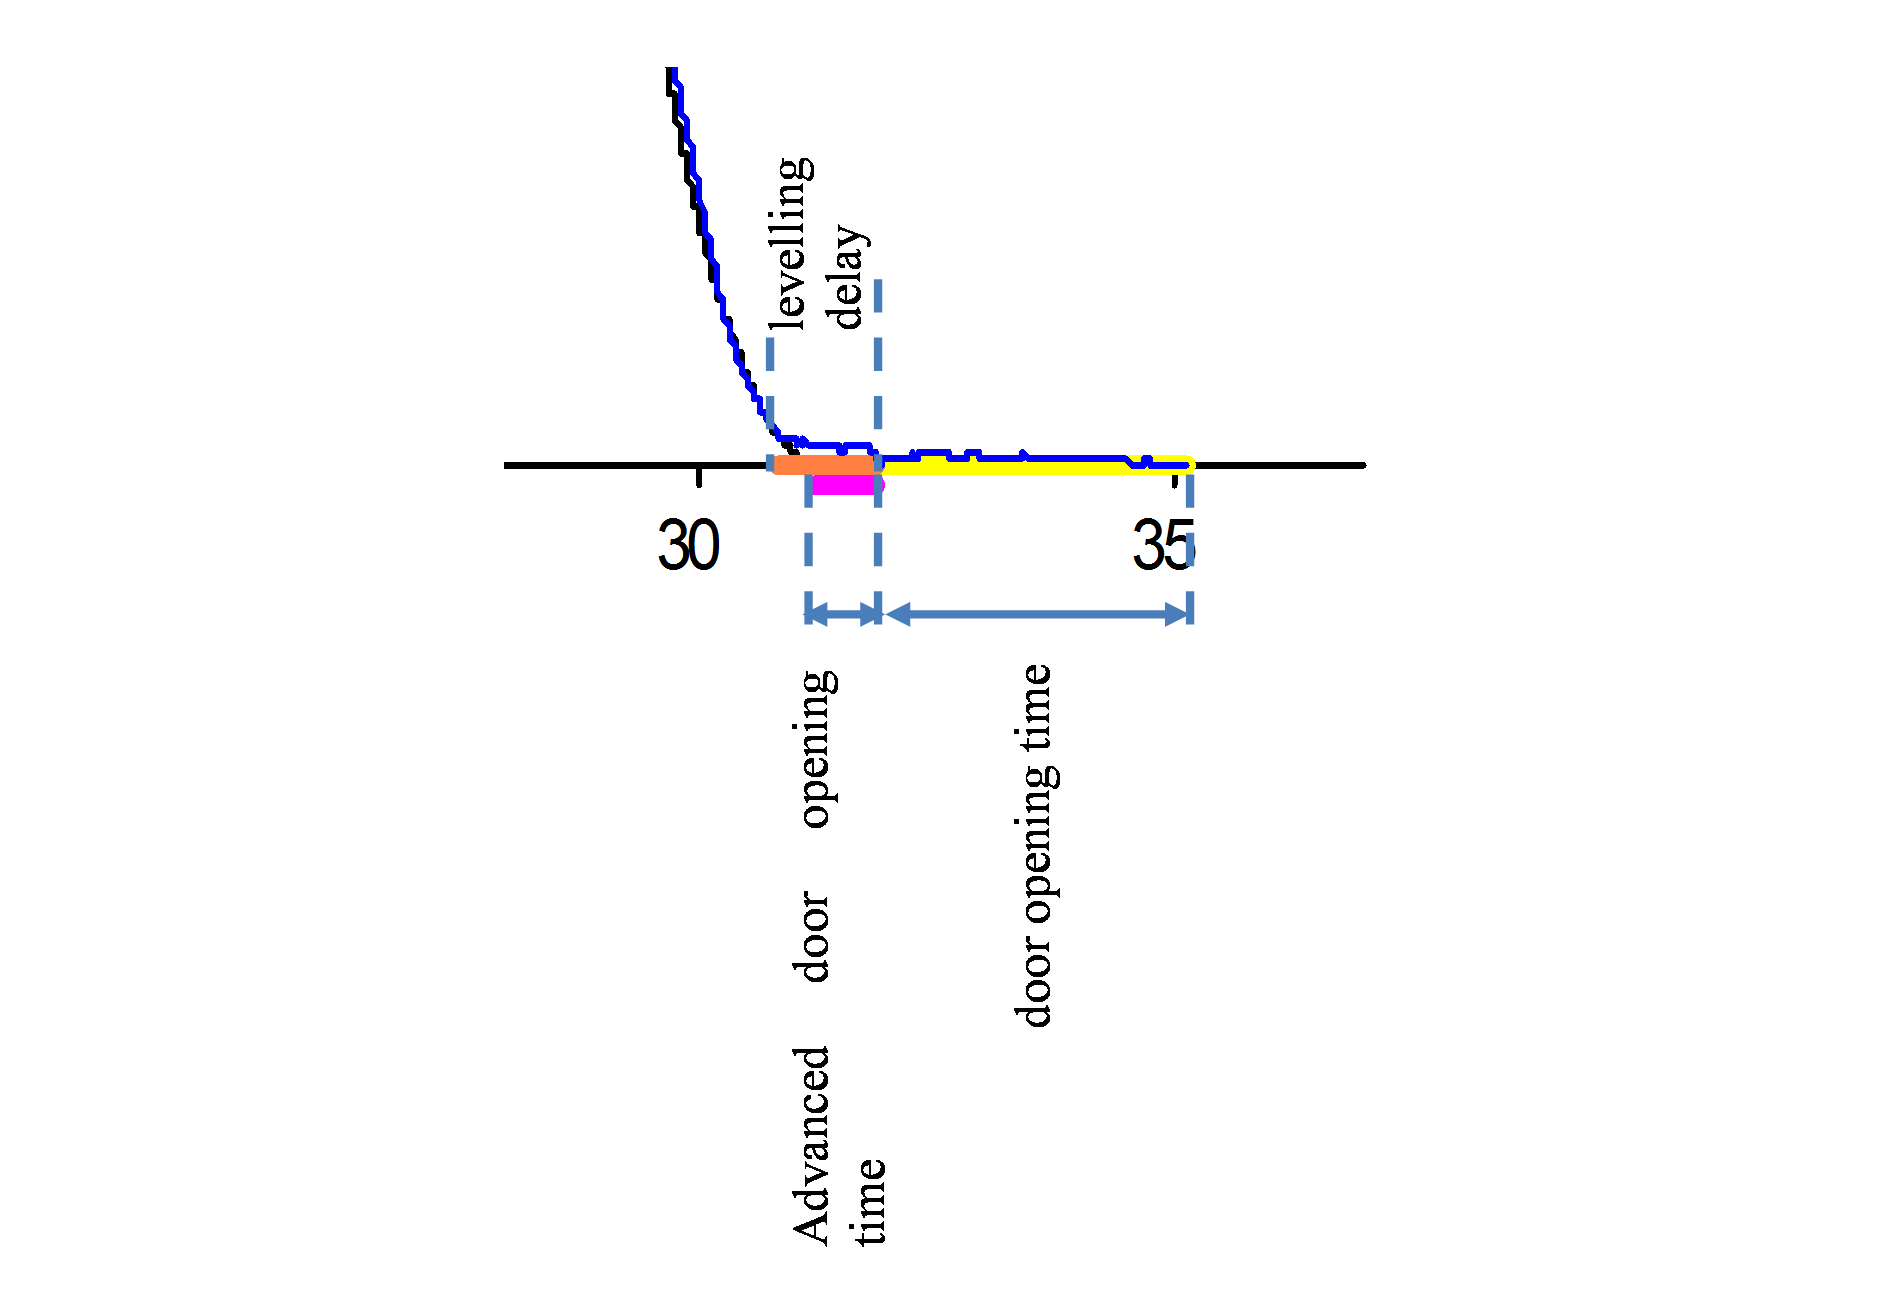
Figure 7 Close up of end of velocity plot showing levelling delay, advanced door opening time and door opening time
The software summarises results which correspond directly to the inputs of our traffic analysis and simulation software (7), see Table 1.
Table 1 Sample performance measurements
| Distance (m) | 79.12 |
| Velocity (m/s) | 3.97 |
| Acceleration (m/s2) | 0.81 |
| Jerk (m/s3) | 0.51 |
| Door opening time (s) | 4.31 |
| Door closing time (s) | 3.84 |
| Start delay time (s) | 1.00 |
| Levelling delay time (s) | 0.61 |
| Advanced door opening time (s) | 1.00 |
Enhanced performance time formulae
As all the performance parameters have been determined, performance time can be now calculated including levelling delay, and for a trip of any distance. Equation (1) is revised to:
T(d) = tf(d) + tsd + tl + tc + to – t_a (2)
The travel time function tf(d) is know from kinematics research (3):
If 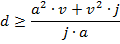 then
then 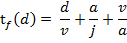 (3)
(3)
If 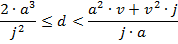 then
then 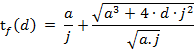 (4)
(4)
If  then
then 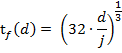 (5)
(5)
Performance measurements
We are building a database of performance measurements to:
- improve industry design guidance for people planning lift installations
- help owners and consultants assess the relative performance of their lift installations, particularly in the context of modernisation projects.
Some initial results are given in this section; we have different amounts of data for each plot as early measurement techniques yielded just some of the parameters. These results include measurements by consulting engineering firm Arup; we welcome others to contribute their measurements. For more information, and the latest results please see our lift performance web pages (6). Currently some results are “peak” rather than “best fit” values; in due course all results will be presented as “best fit” as this allows for more accurate simulation modelling.
Figure 8 shows acceleration measurements; each point represents a separate lift group. Guidance from CIBSE Guide D 2010 (1) Table 3.4 is plotted on the same graph; where CIBSE suggests a range the minimum and maximum is plotted.
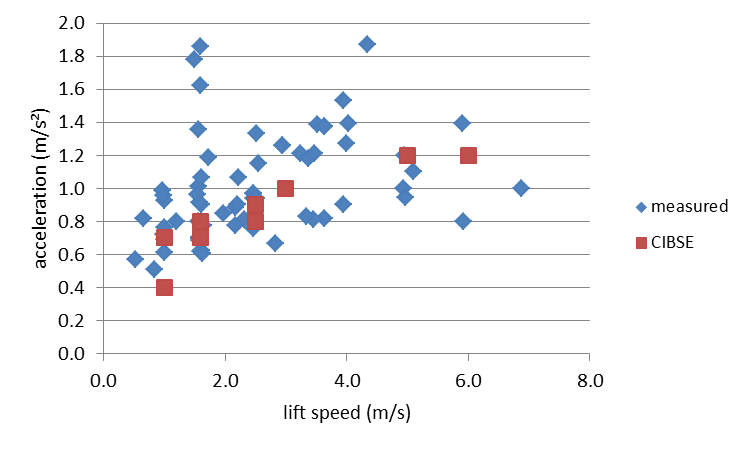
Figure 8 Site measurements of acceleration plotted with CIBSE guidelines
Figure 9 shows jerk measurements. CIBSE Guide D Table 3.4 recommendations are also plotted.
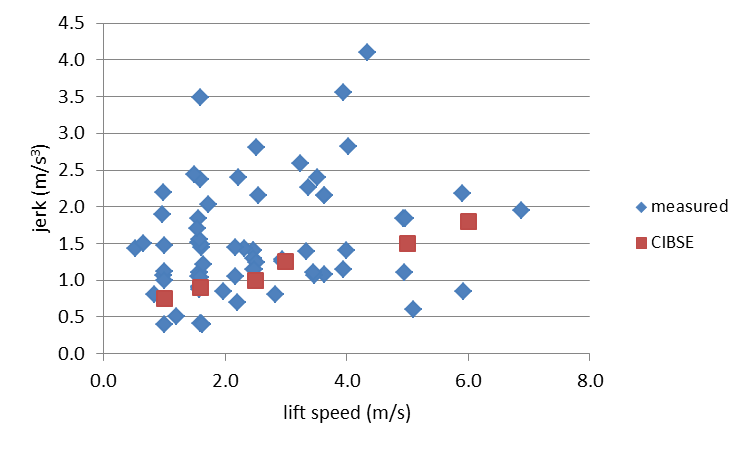
Figure 9 Site measurements of jerk plotted together with CIBSE guidelines
Figure 10 shows motor start delay measurements. CIBSE guidance is to refer to the lift installer, otherwise to assume 0.5 s.
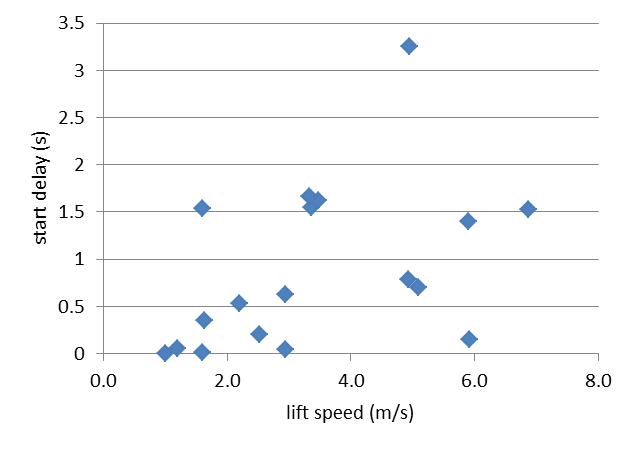
Figure 10 Site measurements of start delay
Figure 11 shows site measurements of levelling delay. This is a new variable not discussed in the current edition of CIBSE Guide D.
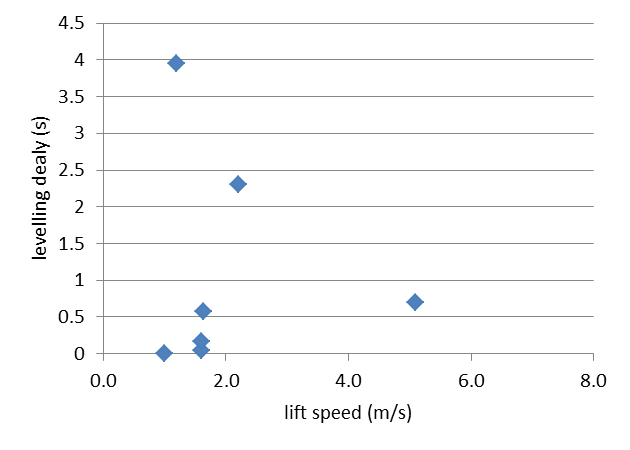
Figure 11 Site measurements of levelling delay
Sensitivity analysis
To investigate the impact of a single parameter, consider a simulation of a building with lunch time traffic, based on Example 4.3 in CIBSE Guide D 2010 (1). This simulation is repeated for increasing start delay. The average waiting time and transit time to destination is plotted in a stacked area graph, Figure 12 .
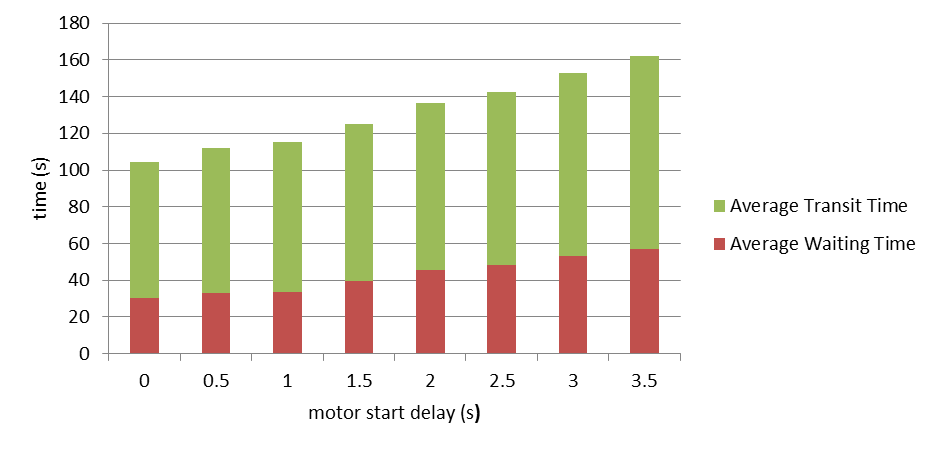
Figure 12 Sensitivity analysis showing impact of motor start delay on simulation results
To investigate the impact on handling capacity, use an up peak round trip time calculation for the same building, again with increasing motor start delay, see Figure 13.
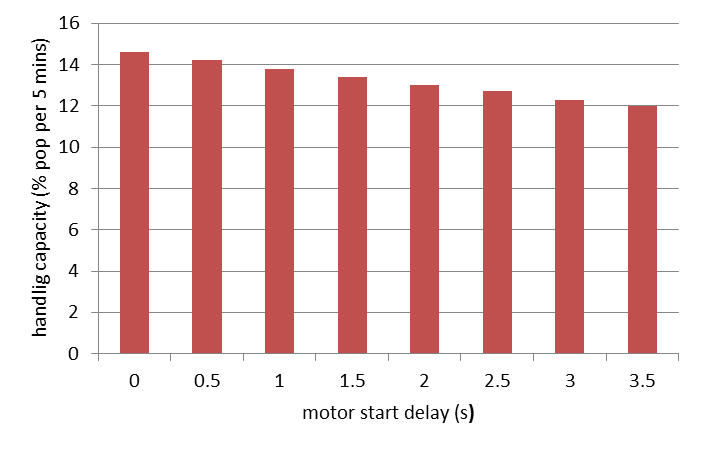
Figure 13 Sensitivity analysis showing impact of motor start delay on handling capacity
Measured variances in a performance time parameter have a major impact on passenger waiting time and handling capacity; variances in other parameters can have an equally dramatic impact. These differences can compromise the traffic design.
Conclusions
Performance measurements demonstrate that CIBSE performance guidelines are achievable, and in some instances are surpassed. However, they also show that sometimes performance is compromised, for example by a long motor start delay. The impact on waiting time, transit time and handling capacity can be significant; this is demonstrated with a sensitivity analysis.
In planning and specification of a lift installation is it important to specify the required performance parameters. Although specifying performance time for a single floor flight time is a valid approach, our recommendation is to specify all the performance parameters individually, as listed in Table 1. In variations provided with tenders, recognise that it is the combination of all the parameters which is ultimately is the most important; for example a 0.5s start delay may be offset by doors which close 0.5s faster. All parameters should be checked as part of the commissioning process, and monitored during the lifetime of the installation to ensure the best possible performance is maintained.
As we can now measure all the performance parameters, if the performance is poor, we have a clear indication of what is going wrong.
Measuring performance is especially important when considering modernisation. In some instances we find clients have been recommended control system upgrades (e.g. to destination control) where adjusting or upgrading equipment to achieve better performance times would represent better value.
REFERENCES
- CIBSE Guide D:2010 Transportation systems in Buildings. London : The Chartered Institution of Building Services Engineers, 2010. ISBN: 987-1-906846-16-1.
- Barney, Gina. Elevator Traffic Handbook. London : Spoon Press, 2003.
- Richard, D Peters. Ideal Lift Kinematics: Derivation of Formulae for the Equations of Motion of a Lift. International Journal of Elevator Engineers. 1996, Vol. 1, 1.
- PMT Physical Measurement Technologies, Inc. . [Online] pmtvib.com
- Henning GmbH & Co. KG. [Online] henning-gmbh.de
- Peters Research Ltd. Elevate Perform. [Online] store.peters-research.com/product/elevate-perform
- Peters Research Ltd. Elevate Traffic Analysis and Simulation Software. [Online] peters-research.com