
Lutfi Al-Sharif1, Richard Peters2
1Mechatronics Engineering Department, The University of Jordan
2Peters Research Ltd.
This paper was presented at The 9th Symposium on Lift & Escalator Technology (CIBSE Lifts Group, The University of Northampton and LEIA) (2018). This web version © Peters Research Ltd 2018.
Keywords: lift, elevator, simulation, calculation, Monte Carlo
Abstract. Lift traffic calculations for planning purposes typically use formulae, or simulation software which applies a traffic control system to dispatch lifts. Formulae methods rely on simplifying the modelling exercise so that the operation of the lifts can be described in mathematical equations. These equations are transparent and repeatable. Simulation is more sophisticated but relies on many advanced dispatching and other complex decisions which are hidden from the user. This can be controversial when results from different simulation software are compared. Monte Carlo Simulation is a calculation tool that does not require simplifying the modelling exercise and can thus produce results that are more representative of reality but are repeatable. In this paper the authors demonstrate how Monte Carlo Simulation can be used to evaluate destination control (also known as hall call allocation) for any traffic mix (incoming, outgoing, inter-floor). The technique requires fewer simplifications than formulae-based methods. It does not require a dispatcher (but requires a simple allocation methodology), making it a supplier independent way to evaluate the application of this form of traffic control.
1 INTRODUCTION
The Monte Carlo simulation method is a powerful numerical tool that can be used to solve complex problems. It has been applied in lift traffic systems [1, 2] and specifically to find the round-trip time [3] and the travelling time [4].
The aim of this paper is to present a method using Monte Carlo simulation to find the value of the round-trip time under destination group control. The round-trip time in this context under the mixed traffic condition is defined as follows:
The average time between the lowest elevator reversal to the following lowest elevator reversal.
A previous paper has presented a method to evaluate the round-trip time under conventional group control [5]. Under conventional group control, passengers arriving for lift service simply board the first available lift that arrives at the landing. Under destination group control [6, 7, 8, 9, 10, 11], passengers arriving for lift service are allocated a specific lift in the group (based on their declared destination floor) and must only board the allocated lift when it arrives at the landing.
There are several distinct steps that are followed in evaluating the round-trip time:
- Passenger origins and destinations are randomly generated based on the origin-destination matrix.
- The passengers are split into up passengers and down passengers.
- The passengers are then sorted based on either their origins or based on their destinations.
- The passengers are then grouped and allocated to the corresponding lift cars.
- The round trips for each of the cars required to deliver the passengers are calculated, including the kinematic time [12].
- The average of the round trips for the L lift cars is taken.
- The procedure is repeated for many trials/scenarios.
- The average of all the round-trip times is taken as the representative value of the round-trip time under destination group control.
The methodology for generating passenger origin destination pairs is presented in section 2. Section 3 outlines the methodology used for grouping passengers in cars under destination group control (either by origins or by destinations). Section 4 presents results for a sample building and discusses these results. Conclusions are drawn in section 5.
2 GENERATION OF PASSENGERS
At the heart of the Monte Carlo simulation methods is the random generation of passenger origin-destination pairs. A systematic method for generating passenger origin destination pairs is the use of the origin-destination (OD) matrix [13, 14, 15] where it assumes that any floor in the building is either an occupant floor or an entrance floor. A more generalised type of OD matrix allows all floors in the building to be simultaneously an occupant and entrance floor [16].
The origin destination matrix is first compiled using the entrance biases for the entrance floors and the percentage populations for the occupant floors, in addition to the mix of traffic of incoming, outgoing, inter-floor and inter-entrance. This produces a square matrix, the dimensions of which are equal to the total number of floors in the building. The matrix has a zero diagonal and all its elements add up to a total of 1. Thus, it represents the probability density function (pdf). It is then integrated and converted to a cumulative distribution function (cdf). Random sampling is then carried out in order to pick origin destination pairs for passengers.
3 PASSENGER GROUPING METHODOLOGY
By its very nature, using the Monte Carlo simulation method for finding the round-trip time under any set of conditions requires that the allocation methodology for the passengers to the lift cars be simple and intuitive. The place for complicated landing call allocation methodologies belong to simulation packages and real-life dispatchers, rather than to the Monte Carlo simulation [17]. This is in recognition of the fact that the Monte Carlo simulation method is effectively a “calculation” tool as opposed to a simulation tool. More information about group control can be found in [18] and [19].
In this section the method of allocating passengers to the lift cars in the group is discussed. Allocating the passengers to cars in the group can be referred to using the generic term of: “passenger grouping”. An interesting introduction to this concept is contained in [20].
The following assumptions have been made:
- Each lift car will serve P passengers in each round trip. This does not necessarily imply that it will have P passengers simultaneously present inside the car at any point during the journey (although this does happen in the cases of 100% incoming traffic or 100% outgoing traffic). It simply means that during one full round trip, P passengers board and alight from that lift car.
- The controller has full advance knowledge of the passenger origins and destinations and hence can allocate passengers to the lifts cars as necessary.
- The Origin-Destination (OD) matrix is compiled using the entrance biases, the occupant floor populations and the mix of traffic.
- In each trial, L·P passengers are generated randomly, where L is the number of lifts in the group. Each passenger has an origin-destination pair of floors (generated in accordance with the OD matrix).
- The passengers are then sorted as up passengers first (in ascending order) and then down passengers (in descending order).
- In the destination control RTT calculation (grouping by origin mode), the passengers are sorted based on their origins, and allocated to each lift car, P passengers at a time.
- In the destination control RTT calculation (grouping by destination mode), the passengers are sorted based on their destinations, and allocated to each lift car, P passengers at a time.
A practical example is graphically shown in this section. It is assumed that a building has a total of 20 floors (including any entrance floors). There are three lift cars in the group (i.e., L=3) and the number of passengers served by each car in one round trip is 5 (i.e., P=5). Thus, in one epoch there are 15 passengers to be generated, allocated to the three cars and delivered to their destinations.
In every trial (scenario) a new set of 15 passengers are generated. An example of one trial/scenario for this building is shown in Figure 1. The up-travelling passengers have been placed on the left hand-side of the figure; and the down travelling passengers have been placed on the right-hand-side of the figure. It must be emphasised that due to the randomness of the passenger origin-destinations, it is possible that, in some trials/scenarios, all 15 passengers are up travelling passengers, or in other trials/scenarios, all 15 passengers are down travelling passengers. In this trial/scenario shown in Figure 1, 7 up passengers have been generated and 8 down passengers have been generated.
The passengers are then grouped by origins as shown in Figure 2. Alternatively, they can also be grouped by their destinations as shown in Figure 3.
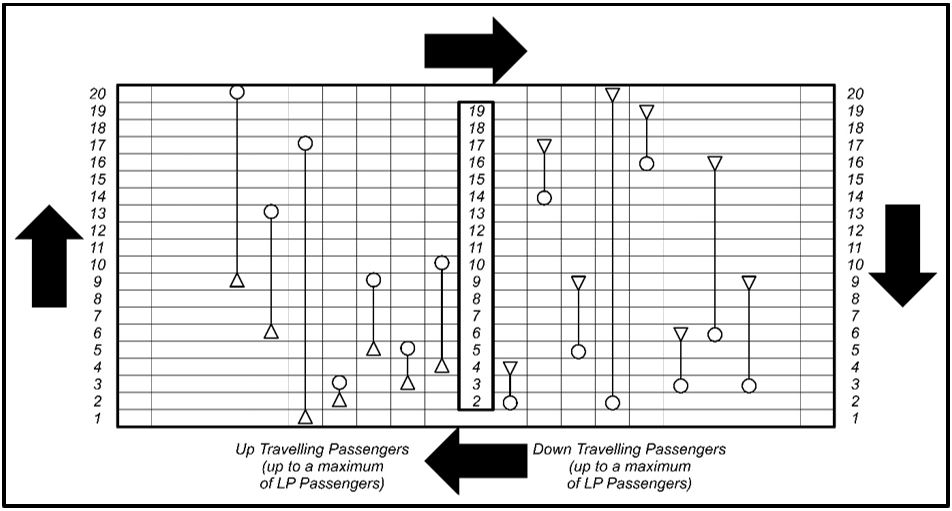
Figure 1 Generating 15 passengers (5 x 3) in a building with 20 floors
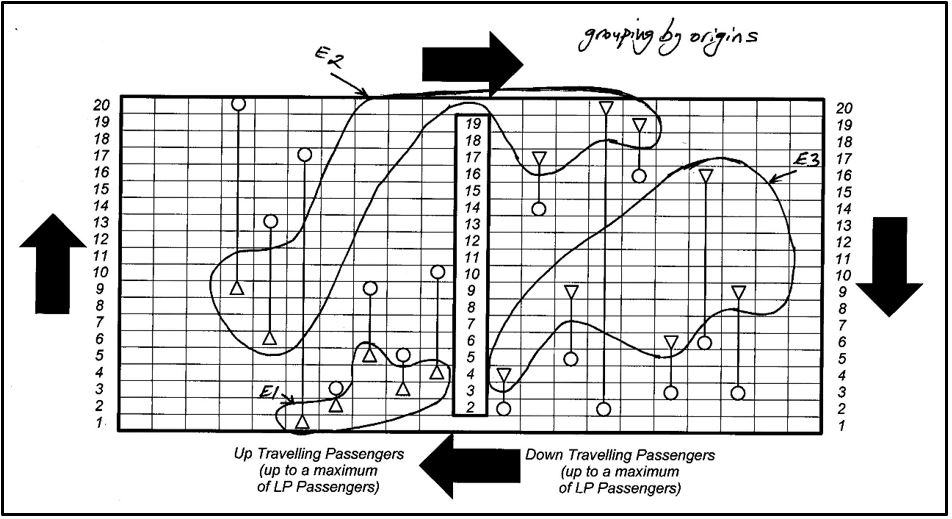
Figure 2 Grouping the passengers in lift cars based on the origin floors of their journeys
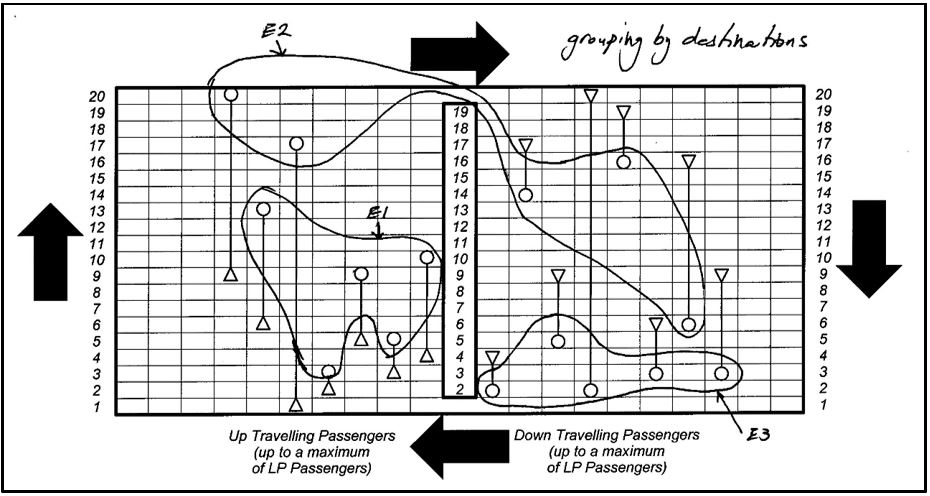
Figure 3 Grouping the passengers in lift cars based on the destination floors of their journeys
It is worth noting that in this example, the point at which the grouping commenced was the lowest origin up travelling passenger (or the lowest destination up travelling passenger. This choice is the simplest one to select. It would have been possible to start at other points. The four most obvious choices are listed below:
- The lowest origin (or destination) up travelling passenger (as used in the example in this section).
- The topmost origin (or destination) down travelling passenger.
- Randomly picking an origin (or destination) for any passenger in each trial.
- Picking the first generated passenger in an epoch and using his/her origin (or destination) as the starting point. This method is likely to yield the same result as option 3 above.
It is likely that the most representative value of the round trip time will result from using option 3 or 4, 50% of the scenarios picking an origin and 50% of the scenarios picking a destination.
4 RESULTS AND DISCUSSION
In order to quantitatively assess some of the results from the software, a sample building was used. The parameters of the building and lift system are shown below.
Sample building parameters
Number of entrance floors: M = 2
Number of occupant floors: N = 12
Entrance bias: 0.3 for the basement; 0.7 for the ground floor.
Number of lifts in the group: L=4
Door opening time: tdo = 2 s
Door closing time: tdc = 3 s
Passenger transfer time: tpi, tpo= 1.2 s
Number of passengers served by a lift car in one round trip: P= 12 passengers
Rated speed: v= 2.5 m/s.
Rated acceleration: a= 1 m/s².
Rated jerk: jerk = 1 m/s3.
Population: 1200 persons equally distributed over 12 occupant floors.
Floor heights in m: df= [5 5 4.5 4.5 4.5 4 4 4 3.5 3.5 3.5 3 3 3]
Number of trials: n= 10 000
Table 1 contains the values of the round-trip time to one decimal place, using 10000 trials (n=10 000). The round-trip time was evaluated for different traffic conditions, such as the morning peak with traffic mix (incoming: outgoing: interfloor) of 85%:10%:5% and the lunchtime traffic mix of 45%:45%:10% [21].
Table 1 Results for the sample building
|
Pure incoming traffic traffic mix |
Morning Traffic traffic mix |
Balanced traffic mix |
Lunchtime traffic mix |
Pure outgoing traffic traffic mix |
|
| Conventional control (i.e., passenger boards the first available lift) |
152.3 s | 166.6 | 174.2 s | 179.9 s | 152.3 s |
| Destination group control (with passenger grouping into the lift cars by passenger destinations) |
105.6 s | 121.5 | 139.3 s | 144.4 s | 143.5 s |
| Destination group control (with passenger grouping into the lift cars by passenger origins) |
143.5 s | 153.4 | 139.3 | 144.4 s | 105.6 s |
Some comments on these results are presented below:
- Invariably, the value of the round-trip time under destination control is smaller than the value under conventional control. This represents a potential hypothetical boost in the handling capacity (assuming that the lift cars continue to serve P passengers in each round trip). For example, a reduction in the value of the round-trip time from 152.3 s down to 105.6 s due to the introduction of destination control represents a potential boost in handling capacity of 44.2%.
- The reduction in the value of the round-trip time is greater in the case of incoming traffic when the passengers are grouped into lift car by destination (rather than their origins).
- Similarly, the reduction in the value of the round trip is greater in the case of outgoing traffic when the passengers are grouped into lift cars by origins (rather than destinations).
- Although not shown in these results, the reduction in the value of the round trip will increase as the number of lifts in the group are increased. This is confirmed by other research [22].
- There is no difference between grouping passengers by origin or by destination under balanced traffic conditions.
- It is useful to examine the boost under handling capacity under destination group control compared to conventional control.
a. The value of the RTT under conventional control, pure incoming traffic (100% incoming, grouped by destination): 152.3 s.
b. The value of the RTT under destination group control, pure incoming traffic (100% incoming) grouped by destination: 105. 6 s.
c. Thus, the boost in handling capacity is equal to 152.3/105.6 = 144.2% or a boost of 44.2%. - However, the boost in handling capacity for lunchtime traffic is much smaller, as shown by the calculations shown below.
a. The value of the RTT under destination group control during lunchtime traffic (45:45:10) is equal to 144.4s.
b. The value of the RTT under conventional group control during lunchtime is 179.9 s.
c. Thus, the boost is only a boost of 179.9/144.4 = 124.6% or a boost of only 24.6%, compared to a boost of 44.2% under incoming traffic conditions.
This result corroborates other research [6] that warns against reducing the number of lifts in the design based on the expected boost in handling capacity under incoming traffic conditions, without considering that the boost in handling capacity under lunchtime conditions is much smaller.
5 CONCLUSIONS
The Monte Carlo simulation method is a powerful numerical tool that can be used to calculate the value of the lift round trip time under destination group control. An epoch has been used as the basis for each trial or scenario of the Monte Carlo Simulation. An epoch is a term borrowed from neural networks and comprises the random generation of LP passengers’ origin-destination pairs, and allocating them to the L lift cars, P passengers per car.
The trial or scenario is repeated a large number of times (e.g., 100 000 or 1 000 000) and the average value of the round-trip time is evaluated and taken as representative of the true value of the round-trip time under destination group control.
As expected, the value of the round-trip time under destination group control was consistently smaller than the value under conventional group control. The ratio of the two round trip times was presented as a representative of the boost in handling capacity that results from the application of destination group control. As expected, the boost in handling capacity was largest in the case of incoming traffic conditions (when passengers were grouped by destinations) and hovered around 1.45 (i.e., 45% boost in handling capacity). The boost was smaller under lunchtime traffic conditions.
The group of passengers into the lift cars was carried out based on contiguous passenger origins first and then destinations. Grouping based on destinations was advantageous under incoming conditions, while grouping based on origins was advantageous under out-going traffic conditions.
REFERENCES
- Powell B. The role of computer simulation in the development of a new elevator product. Proceedings of the 1984 Winter Simulation Conference, page 445-450, November 1984, Dallas, TX, USA, published by INFORMS, Catonsville, MD 21228, United States.
- Tam C M and Chan A P C. Determining free elevator parking policy using Monte Carlo simulation. International Journal of Elevator Engineering 1996; 1:24-34.
- Al-Sharif L, Aldahiyat H M and Alkurdi L M. The use of Monte Carlo simulation in evaluating the elevator round trip time under up-peak traffic conditions and conventional group control. Building Services Engineering Research and Technology 2012; 33(3): 319–338. doi:10.1177/0143624411414837.
- Al-Sharif L, Abdel Aal O F and Abu Alqumsan A M. Evaluating the Elevator Passenger Average Travelling Time under Incoming Traffic Conditions using Analytical Formulae and the Monte Carlo Method. Elevator World 2013; 61(6): 110-123. June 2013.
- Al-Sharif L. MATLAB CODE TO EVALUATE THE ELEVATOR ROUND TRIP TIME USING MCS The Use of In-Class Problem Based Learning for Final Year Engineering Students. Lift Report 2018; 44(1): 14-20.
- Peters R. Understanding the benefits and limitations of destination dispatch. Elevator Technology 2006; 16: 258-269. The International Association of Elevator Engineers (Brussels, Belgium), the proceedings of Elevcon 2006, June 2006, Helsinki, Finland.
- Smith R and Peters R. ETD algorithm with destination dispatch and booster options. Elevator Technology 12 2002; 12: 247-257. The International Association of Elevator Engineers (Brussels, Belgium), proceedings of Elevcon 2002, Milan, Italy, June 2002.
- Schroeder J. Elevatoring calculation, probable stops and reversal floor, “M10” destination halls calls + instant call assignments. Elevator Technology 3 1990; 3: 199-204. Proceedings of Elevcon ’90, The International Association of Elevator Engineers (Brussels, Belgium), Rome, Italy, March 1990.
- Sorsa J, Hakonen H and Siikonen M L. Elevator selection with destination control system. Elevator Technology 15 2005; volume 15; 202-211. The International Association of Elevator Engineers (Brussels, Belgium), proceedings of Elevcon 7th to 9th June 2005, Peking, China.
- Smith R and Peters R. Enhancements to the ETD dispatcher algorithm. Elevator Technology 2004; 14: 234-243. The International Association of Elevator Engineers (Brussels, Belgium), Proceedings of Elevcon 2004, Istanbul, Turkey, April 2004.
- Lauener J. Traffic performance of elevators with destination control. Elevator World (Mobile, AL, USA) 2007; 55(9): 86-94.
- Peters R D. Ideal lift kinematics: derivation of formulae for the equations of motion of a lift. International Journal of Elevator Engineers, 1996; 1(1): 60-71.
- Al-Sharif L. Building the Origin-Destination Matrix under General Traffic Conditions and Using it to Generate Passenger Origin-Destination Pairs (METE XII). Lift Report 2016; 42(3):24-33.
- Al-Sharif L and Abu Alqumsan A M. Generating the Elevator Origin-Destination Matrix from the User Requirements Specification under General Traffic Conditions. Elevator Technology 2016; 21: 1-13. Proceedings of Elevcon 2016. Madrid/Spain: The International Association of Elevator Engineers.
- Al-Sharif L and Abu Alqumsan A M. An Integrated Framework for Elevator Traffic Design under General Traffic Conditions Using Origin Destination Matrices, Virtual Interval and the Monte Carlo Simulation Method. Building Services Engineering Research and Technology 2015; 36(6): 728-750.
- Al-Sharif L. The Universal Origin-Destination-Matrix with Dual Designation Floors as Entrances and Occupant Floors. Lift Report 2018; 44(2):36-45.
- Al-Sharif L and Al-Adem M D. The current practice of lift traffic design using calculation and simulation. Building Services Engineering Research and Technology 2014; 35(4): 438-445.
- Al-Sharif L. Introduction to Elevator Group Control (METE XI). Lift Report 2016; 42(2):59-68.
- Barney G C and Al-Sharif L. Elevator Traffic Handbook: Theory and Practice. 2nd Edition. Routledge, Abingdon-on-Thames, United Kingdom. 2016.
- Christy T. An Evolution of Lift Passenger Grouping. Elevator Technology 20 2014; 20: 41-50. The International Association of Elevator Engineers (Brussels, Belgium), the proceedings of Elevcon 2014, Paris, France, 8-10 July 2014.
- CIBSE (Chartered Institute of Building Services Engineers). CIBSE Guide D: Transportation systems in buildings. 2015. Published by the Chartered Institute of Building Services Engineers (Balham, London, United Kingdom), Fifth Edition.
- Al-Sharif L, Hamdan J, Hussein M, Jaber Z, Malak M, Riyal A, AlShawabkeh M and Tuffaha D. Establishing the Upper Performance Limit of Destination Elevator Group Control Using Idealised Optimal Benchmarks. Building Services Engineering Research and Technology, 2015; 36(5):546-566. September 2015.
BIOGRAPHICAL DETAILS
Lutfi Al-Sharif is currently professor of building transportation systems at the Mechatronics Engineering Department at the University of Jordan, Amman, Jordan. His research interests include elevator traffic analysis and design, elevator and escalator energy modelling and simulation and engineering education. He combines his university teaching schedule with consultancy and training for Peters Research Ltd
Richard Peters has a degree in Electrical Engineering and a Doctorate for research in Vertical Transportation. He is a director of Peters Research Ltd and a Visiting Professor at the University of Northampton. He has been awarded Fellowship of the Institution of Engineering and Technology, and of the Chartered Institution of Building Services Engineers. Dr Peters is the author of Elevate, elevator traffic analysis and simulation software.