
Dr. Rory S. Smith
ThyssenKrupp Elevator
This paper was presented at The 2nd Symposium on Lift & Escalator Technology (CIBSE Lifts Group, The University of Northampton and LEIA) (2012). This web version © Peters Research Ltd 2019
1. Introduction
The Up Peak Round Trip Time (UPRTT) method is based upon a traffic pattern presented by Strakosch in the 1960’s. This traffic pattern and the whole concept of how of how people use lifts has been called “a figment of the imagination” by Barney [1]. Barney goes on to state that “Countless buildings have been designed to its ‘illusion’ and the designs work”.
The science behind the UPRTT method is examined and explained. The correctness of using a traffic estimate that does not initially appear to reflect reality is explored.
Elevatoring solutions for proposed buildings were developed using the UPRTT method. The same proposed buildings were also evaluated using simulation and applying modern estimates of traffic and the application of new technologies.
The solutions developed using the UPRTT method were shown to provide good traffic handling. The different solutions that were developed using simulation were found to provide equal or better traffic handling while being lower in cost and more sustainable.
2. Background
The Up Peak Round Trip Time calculation is a method of determining the performance of a lift system during the morning up peak. The proper number of lifts, their capacity and their speed can determined using multiple iterations of this calculation to achieve the desired quantity and quality of service for a proposed building.
Barney states that Up-peak traffic sizing defines the underlying capability of a lift installation [1].
Since Up-peak sizing is believed to be an important way of determining the underlying capacity of a lift installation it is important to understand this process.
Up-peak sizing is based upon calculating the round trip time of a lift during the Up-peak period and then using that round trip time to calculate Interval and Handling Capacity. This concept was first postulated by Basset Jones in 1923 and was later refined by Schroeder in 1980 to include a statistical determination of the probable high call reversal floor [1].
The Up-peak Round Trip can be simply described. A lift appears in the lobby and passengers fill the lift to capacity. The lift then deposits the passengers at multiple upper floors. When the lift is empty it returns to the lobby to pick up additional passengers. It should be noted that during this round trip there is neither inter-floor nor downward traffic.
An Up-peak traffic analysis requires the following:
- A definition of the building’s characteristics. This would include the building type (office, apartment, school, hospital, etc), class of building (Class A, Class B, luxury, government housing), tenant type (single, multiple), occupancy (area per person, area per floor), location (downtown, suburban, developing nation, developed nation), cultural expectations of users, floor to floor heights, and the relative desirability of floors [2].
- Lift characteristics. These characteristics include the number of lifts, capacity, speed, door type, and door speed.
- Traffic demand level or arrival rate.
Based upon the car size and the number of floors above the ground floor the number of probable stops that the car will make is calculated using the following equation [3]:
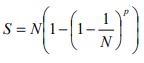 (1)
(1)
Where:
S represents Probable Stops
N is the Number of floors above the main floor
p is the number of Passengers per trip
The highest floor that will be reached on a typical trip is a function of the number of floors in a building and the passengers per trip. The high call reversal floor is calculated as follows [1];
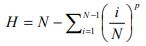 (2)
(2)
Where:
H is the High call reversal floor
N represents the Number of floors above the main floor
p represents the number of Passengers per trip
Using the calculated number of probable stops and the high call reversal floor, it is possible to calculate the time spent running at full speed, the time spent accelerating and decelerating, and the time spent making each of the probable stops. The sum of all these times is the round trip time.
Using the Round Trip Time (RTT) the Interval (INT) is calculated by dividing the RTT by the number of lifts in a group of lifts. For example, if the RTT for one car in a group of three cars is 90 seconds, then the Interval is 30 seconds. In theory, a lift should arrive at the lobby every 30 seconds if the lifts are perfectly spaced and the actual RTT is equal to the average RTT. The following is the equation for Interval [1]:
 (3)
(3)
Where:
I is Interval
RTT represents Round Trip Time
NC is the Number of Cars
The average Waiting Time will be one half the average Interval. If the arrival of passengers was equally spaced in time, then the first passenger would arrive just as the lift doors closed and would wait for a length of time equal to the Interval. Likewise, the last passenger to arrive in the lobby would enter the lift just as the lift doors started to close and would have no waiting time. The simplified equation for Waiting Time (WT) is [3]:
 (4)
(4)
Where:
WT represents Waiting Time
I represents Interval
Waiting time would be equal to the Interval divided by two if a passenger could enter the first lift that appears in the lobby. However, this is not always possible during the morning Up-peak. For this reason, Waiting Time is assumed to be about 60% of Interval [3].
As previously stated, an Up-peak traffic analysis requires the following:
- A definition of the building’s characteristics
- Lift characteristics.
- Traffic demand level or arrival rate.
The first two requirements involve known data, while the third requirement is an estimation. The Up Peak Round Trip Time method is a prediction of lift system performance based on prediction of traffic demand.
The traffic demand level is assumed to be 12% of the building’s population in multi-tenant buildings and 18% of the building’s population in single tenant buildings [3]. The origin of these values is from the traffic pattern shown in Figure 1. This traffic pattern is known as the Strakosch Traffic pattern. The demand level during the morning UP-peak can be seen to be 12%.
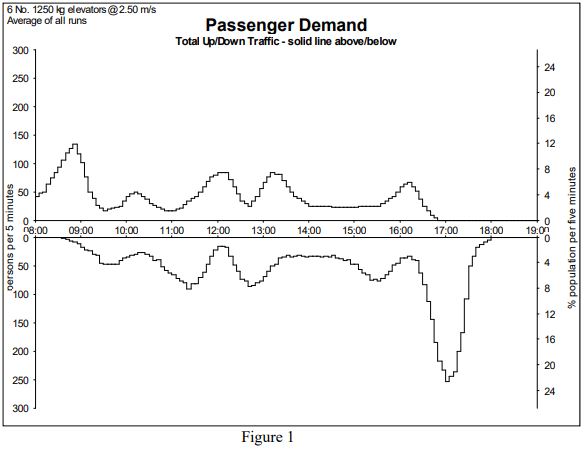
This traffic pattern and the whole concept of how of how people use lifts has been called “a figment of the imagination” by Barney. Barney goes on to state that “Countless buildings have been designed to its ‘illusion’ and the designs work” [1].
3. Analysis example
To better understand the UPRTT method and to compare and contrast the results between simulation and the UPRTT method a hypothetical building is evaluated.
Hypothetical building:
Floors: 18 (Lobby +17)
Travel 66.8 meters
People per floor: 62
Proposed Lift System:
Cars: 6
Capacity: 1600 Kg.
Speed: 2.5 m/s
The UPRTT system performance was evaluated using a computer program. The results are as
follows:
5 minute handling capacity: 12.6%
Interval: 31.2 seconds
Using the Enhanced UP Peak calculation with 12% demand gave the following results:
Interval 29.7 seconds
Based upon this result one would assume that the proposed lift system would be capable of handling 12.0% of the building’ population during Up Peak conditions. However, when a simulation was run using a dispatching algorithm employed by an early microprocessor based control system with an arrival rate of 12%, the system saturated as can be seen in Figure 2. This dispatching algorithm most likely performed at a level similar to a good relay based system.
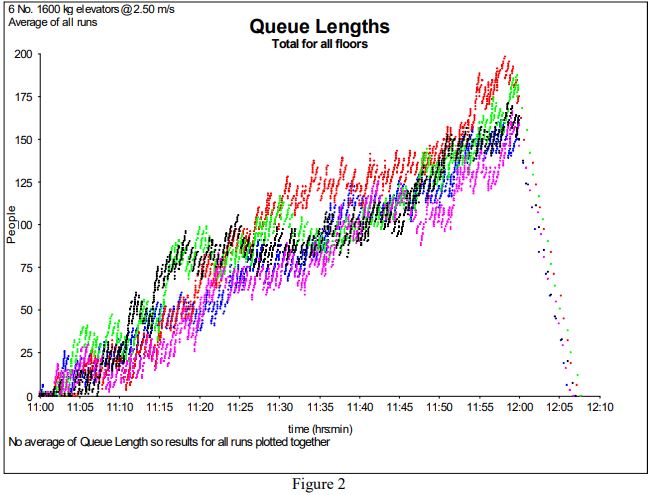
Figure 3 shows the results of a simulation of the up peak performance of the same lift system in the hypothetical building at a 10% demand level.
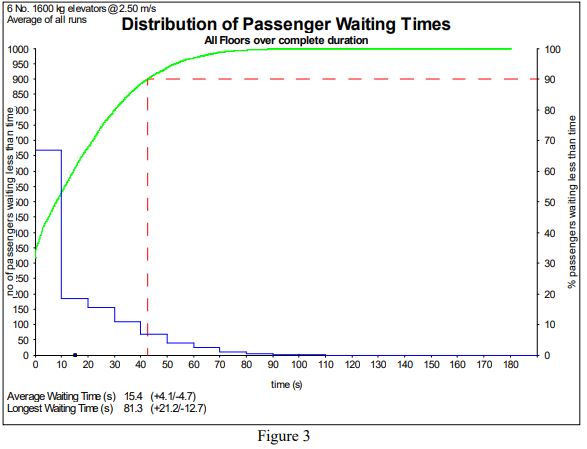
The UPRTT method predicted that the proposed system could handle 12% of the building system. The proposed system saturated at the 12% level but could handle a 10% demand level. As long as the real traffic level was 10% or less, the proposed system would deliver acceptable performance. One must conclude that actual traffic levels in real buildings were less than 12% because as Barney stated, “the designs worked” [1].
The difference between the demand level used in calculations and the real traffic levels can be viewed as a Safety Factor.
4. Safety factors
Safety factors are commonly used in the design of almost any device where the consequences of failure of the device will result in substantial financial loss, serious injury or death [4]. An under lifted building can result in significant financial loss because it cannot command the same rents as a properly lifted building. There is, however, little risk of injury or death as a result of a poorly lifted building.
Safety factors in industrial design are selected based upon the risks involved, the variability of the component, wear estimates, and the accuracy of predictions used in the design. Wire ropes for lifts require a minimum safety factor of 12 [5]. However, some aircraft components have a safety factor of 1.2 [4].
Lower safety factors are possible if there is low product variability due to quality control processes such as Six Sigma. Improved calculation methods such as Finite Element Method make predictions of structural performance more accurate and therefore lower safety factors are possible [4].
The UPRRT method is based on the traffic pattern shown in Figure 1. The UPRTT method is a calculation tool. The designs developed by this tool work because the designs are based on a safety factor created by the 5 minute handling capacity selected. A design with a 5 minute handling capacity of 12% has a safety factor because the true traffic that the lift system will encounter will be less demanding than 12% of the building population, all traveling upward.
Better calculation methods permit the use of lower safety factors. Simulation has been shown to have a very high correlation between its predictions and actual system performance [6]. Simulation methods have the ability to better predict lift system performance.
The UPRTT method has been shown to require more lifts that would be required if simulation were used to calculate the required number of lifts for proposed building [7].
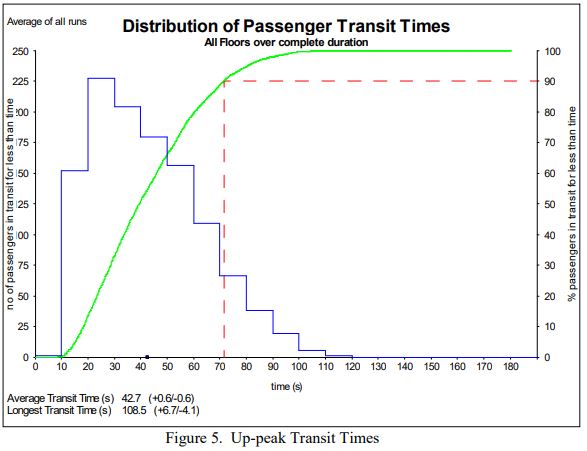
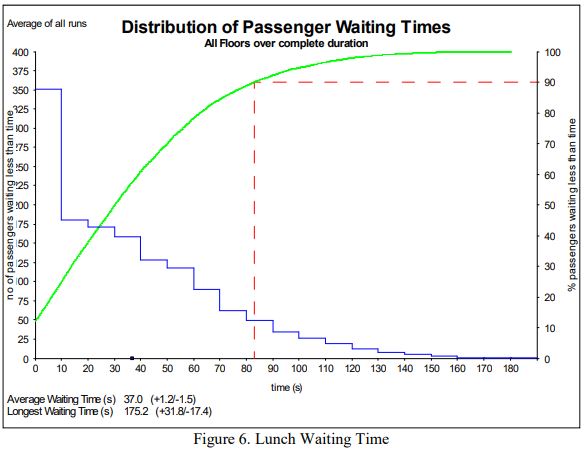
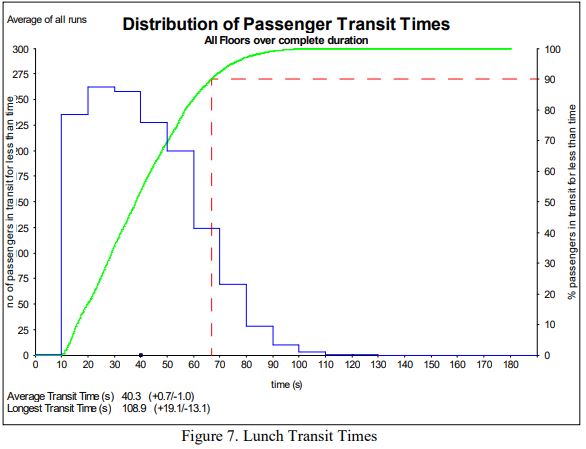
As an example of this, the hypothetical building that required 6 lifts based upon the UPRTT method was evaluated based upon applying 5 high performance lifts using simulation and the modern estimates of traffic presented by Peters in CIBSE Guide D [8]. Figures4 – 7 record the performance of the 5 lifts during the modern Up-peak and the modern Lunch.
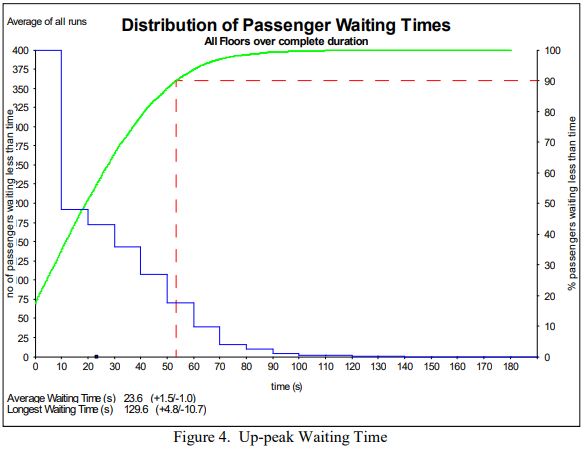
The waiting times for the 5 car high performance group are between a 4 star and a 5 star building according to the Quality of Service criteria in the 2010 edition of CIBSE Guide D [8].
The transit times for the 5 car high performance group are between a 6 star and 7 star building.
The performance of this group most likely is that of a 5 star building. A prestige building is described as a 5 star building in CIBSE Guide D [8].
5. Findings and conclusions
The Up Peak Round Trip Time (UPRTT) calculation method uses the parameters of a proposed building and a proposed lift system along with an estimate of anticipated traffic. The anticipated traffic levels used constitute a safety factor. The true traffic level in a building is normally less than that which is proposed in the UPRTT method.
The inclusion of a Safety Factor explains why the UPRTT method works.
Simulation provides a more accurate calculation method than the UPRTT method. The more accurate calculation provided by simulation combined with a more accurate understanding of how people use lifts and more accurate descriptions of traffic patterns permit lift designs to be a better predictor of system performance. The better estimates of performance will lead to designs with fewer lifts.
A building with fewer lifts is more economical and more sustainable.
REFRENCES
- G. Barney, Elevator Traffic Handbook. London: Spon Press (2003)
- DLABID, Downtown Los Angeles Business Improvement District. (2007) Office Space Available from: http://downtownla.com/dbh_office_space.asphttp://downtownla.com/dbh_office_space.asp Accessed 12 August 2007.
- G. Strakosch, The Vertical Transportation Handbook. Wiley, New York (1998)
- Wikipedia. Factor of Safety Available from http://en.wikipedia.org/wiki/Factor_of_safety Accessed 13 July, 2012
- European Standard EN-81A1 (1998) Safety Rules for the construction and installation of lifts – Part 1: Electric Lifts (1998)
- R. Peters, and R. Smith, Analysis of Elevator Performance and Passenger Demand with Destination Control Elevator Technology 17, Proceedings of ELEVCON 2008 (The International Association of Elevator Engineers) (2008)
- R Smith, Determination of Lift Traffic Design Requirements based on New Technologies and Modern Traffic Patterns, University of Northampton, Northampton (2011)
- CIBSE, The Chartered Institution of Building Services Engineers Transportation Systems in Buildings, Guide D. CIBSE, Norwich (2010)