
Lutfi Al-Sharif [i], Richard Peters [ii], Rory Smith [iii]
Al-Sharif VTC Ltd., UK [i]
Peters Research Ltd., UK [ii]
ThyssenKrupp Elevator Inc., USA [iii]
Key Words: Energy consumption, simulation, motors, drives, mathematical modelling
This paper was presented at ELEVCON ISTANBUL 2004, The International Congress on Vertical Transportation Technologies and first published in the IAEE book “Elevator Technology 14”, edited by A. Lustig. It is reproduced with permission from The International Assocication of Elevator Engineers. The paper was republished by Elevator World (November 2004). This web version © Peters Research Ltd 2009.
Abstract
Current methods for calculating elevator energy consumption rely on rules of thumb, the accuracy of which is very limited. In this paper a new general energy modelling approach is proposed. The resulting energy model can be used to calculate the energy consumption of any individual elevator trip. The energy model is linked to an elevator traffic simulation program, which enables the energy consumption of an elevator installation to be calculated in any building, and for any passenger traffic scenario.
1. Introduction
The energy consumption of an elevator installation is a significant proportion of the total building electrical load. Estimates range from 5 to 15% [1] depending on the other services installed in the building. Understanding energy usage and costs is becoming increasingly important to clients of the elevator industry. Thus it is necessary to able to predict, with reasonable accuracy, the energy usage of a new elevator installation and of an existing installation post modernization.
2. Basic models for calculating energy consumption
2.1 General
Section 13 of CIBSE Guide D Transportation systems in buildings [1] provides an overview of calculation techniques which can be applied to estimate how much energy an elevator installation will consume.
2.2 Doolard’s measurements
Doolard carried out a large number of measurements on various elevator drives [2]. He measured the energy consumed by each elevator when it made a round trip: up three floors and back, then down three floors and back. The elevators were empty. The results were normalised against the mass of the car and plotted against rated speed. In themselves, Doolard’s measurements were not a means for calculating the energy consumption of other elevator installations, but an indicative comparison between the different elevator drive technologies. CIBSE Guide D Transportation systems in buildings [1] provides a method for using Doolard’s results to make the extrapolation so that the data can be applied to other installations.
2.3 Schroeder’s method
Schroeder developed a simple method for calculating energy consumption using a table and basic formulae [3]. The table estimates the duration of a typical journey for an elevator depending on the number of floors in the building and the speed of the elevator. By using the number of elevator starts per day, and by assuming that the motor was drawing its full power during running, an estimate for the daily energy consumption of the elevator is made. Multiplying this by the number of working days per year and then dividing by the area in the building, a figure of merit can be calculated to assess the energy consumed by the elevators per m² of the building per year.
2.4 Discussion
In CIBSE Guide D Transportation systems in buildings the Doolard and Schroeder methods are compared in an example, and are shown to be inconsistent by almost a factor of two! These methods are only suitable for rule of thumb calculations, and for making comparative assessments between different configurations. They cannot assess the benefits of regenerative drives, different roping arrangements, different efficiency motors or gearboxes, and so on. The models are based on fixed journey lengths without reference to speed or acceleration. Given the importance of energy saving, a better means of calculating energy consumption is required. The model conceived by the authors could be used to calculate the energy consumption of any single elevator trip. The modelling approach proposed breaks the elevator trip down into the main energy consuming components, which are discussed in the following section.
3. Basic principles of energy transfer
A counterweighted traction elevator acts as a storage device for energy. In an ideal world, with no friction and losses, ‘energy is never consumed in an elevator; it is borrowed and then returned’. Taking an office building as an example, all of the passengers who go up the elevators in the morning, will come down again. So, unless they choose to take the stairs, the potential energy that has been ‘stored’ in them in the morning will be returned to the system in the afternoon. It is the inefficiencies in the system that cause the loss of energy. In fact, had it not been for the inefficiencies in the elevator system, there would be no need to study energy consumption in elevators, as the net consumption of energy in the long term would be zero!
The elevator system basically converts the input electrical energy into mechanical output energy, with losses in the form of heat (and some noise). Taking a simplified diagram representing energy flow into and out of the elevator system (see Figure 1), there are three active phases in energy flow: system being accelerated, constant speed phase and deceleration phase.
Figure 1 Diagram representing the flow of energy during different
phases of an elevator trip
Measurements have been carried out on a wide range of elevator systems in order to understand the flow of energy into and out of the system. As an example, Figure 2 shows the energy consumption of an 1800 kg elevator running at 2 m/s. The journeys are plotted for up and down trips with the car carrying 25%, 42% and 75% of its rated load. The system is counterbalanced at 42% of rated load; in this case the mass of the car plus the mass of the load is equal to the mass of the counterweight. Figure 2 is divided into five distinct phases, for which the energy flow can be summarised as follows:
1. When the elevator is stationary prior to the start of the journey, the only energy consumed is that needed to keep the controller running.
2. Once the elevator starts accelerating, energy is drawn by the system to provide kinetic energy for the moving masses. Potential energy will also be drawn or returned as in the following phase 3.
3. At the end of the acceleration phase, no more kinetic energy is needed as the speed is constant. For cars travelling up: if the car plus its load is heavier than the counterweight, then the system is drawing and storing potential energy. If the counterweight is heavier, then the system is returning potential energy. Similarly for cars travelling down, potential energy may be stored or returned.
4. At the end of the constant speed phase, the elevator starts decelerating and the kinetic energy that has been stored in the moving masses is being returned. Potential energy will also be drawn or returned as in phase 3.
5. Once the elevator comes to a standstill, the elevator returns to the first phase above, where the only energy consumed is that needed to keep the controller running.
When the net energy required is negative, regenerative drives will return the energy back to the supply; in Figure 2 this is represented by the shaded area of the graph.
Figure 2 Speed and energy consumption of an elevator carrying different loads
4. Energy simulation model
4.1 Implementation
Applying the concepts discussed, mathematical models were developed. Hydraulic and electric elevators require different, but similar models. The mathematics is complex and outside the scope of this paper. The models have been implemented using the C++ programming language. Calibration of the models is based on measurements taken by the authors at a wide range elevator installations, utilising equipment from different manufacturers.
For an individual site, the model can be calibrated to match almost exactly the energy consumption of a trip of any distance, in either direction, and for any load.
Figure 3 shows a graph of energy consumption for different trips of the same distance by an electric elevator. Each plot is for a trip the same distance, but in different directions and for different loads. Figure 4 shows the same trips with the energy consumption calculated by the mathematical model.
Figure 3 Measured energy consumption of an 1800 kg elevator for trips in both
directions with the elevator carrying different loads
Figure 4 Energy consumption as calculated by the energy model for
the elevator trips shown in Figure 3
Having built a model that could calculate the energy consumption for any trip of any load and direction, this is best applied in conjunction with a traffic simulation program. A non-proprietary traffic simulation program, Elevate™, was customised to apply the new energy model.
The traffic simulation program uses the information about the elevator installation and passenger traffic to give the energy model details of every trip that is made. The energy model calculates the power consumed, displaying a Watt-hour meter during simulations, and the total power consumed at the end of the simulation (see Figure 5). Power factor measurements will be added to a future version of the model.

Figure 5 Simulation Model showing kWh measurement
By generating a passenger traffic profile for a whole day, the daily energy consumption can be measured. Figure 6 is a representation of traffic for the whole day in an office building, based on measurements made in a multi-tenant office building [4].
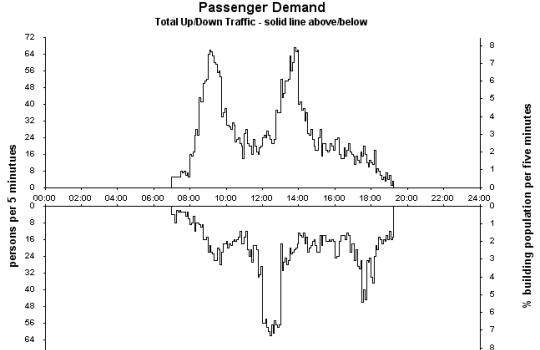
Figure 6 Graphical Representation of traffic over a whole day in a
sample multi-tenant office building
The model can be used to measure the effects of adjusting a wide range of variables, including:
· type and efficiency of drive (motor)
· whether the drive is regenerative or not
· whether the installation is geared or gearless
· roping arrangement including roping ratio and single/double wrap
· rated load of the car
· mass of the empty car
· counterbalancing ratio
· floor heights
· dispatcher logic
· speed, acceleration and jerk values
4.2 Application
Figure 7 shows the Elevator Data input screen for the simulation model in Standard mode. For basic energy modelling, the user can simply select the drive. Inputs for gearing, regeneration, compensation, roping and wrap can selected, or left in Auto mode. In Auto mode, the program selects intelligent defaults for the inputs.
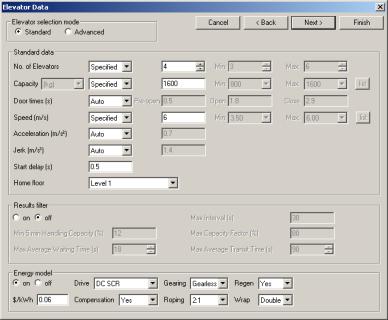
Figure 7 Simulation data input screen in Standard mode
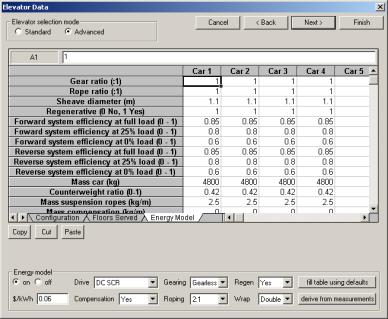
Figure 8 Simulation data input screen in Advanced mode
Figure 8 shows the Elevator Data input screen in Advanced mode. In this mode, the user can specify every input to the model. This includes parameters like the mass of the car, efficiencies, counterbalancing ratio, rope length, etc. There is a speed fill button to fill the table with default data based on the Standard mode inputs.
5. Conclusions
Energy modelling is a complex subject, and previous methods have provided only basic rules of thumb. The new energy simulation model is a major step forward on previous approaches. Energy modelling will always present some uncertainty, as usage cannot be predicted with total precision. But now there is an energy simulation model that is fundamentally sound.
The energy simulation model provides a tool to assess the energy consumption of a new elevator installation, and a means of assessing the energy benefits associated with modernization. It is also straightforward to calculate the payback time for options such as selecting an electric elevators over a hydraulic, or a regenerative drive over a non-regenerative drive.
The energy model is currently being used to assess energy consumption for new elevator systems, and for modernization projects. It is also being applied in research to develop new energy saving technologies.
ACKNOWLEDGEMENTS
This research project was commissioned and managed by Mr. Smith for the ThyssenKrupp TRIaD Product Planning Group. The mathematical models were conceived by Dr. Al-Sharif, and developed by Dr. Al-Sharif with the assistance of Dr. Peters. The site measurements required to calibrate the model were made with the assistance of Mr. Smith, and the ThyssenKrupp offices in London and Chicago.
The energy model discussed in this paper is a ThyssenKrupp enhancement to the Peters Research Ltd simulation software, Elevate™. Clients of ThyssenKrupp wishing to apply the energy model should enquire at their local ThyssenKrupp sales office.
REFERENCES
- Al-Sharif L Lift and Escalator Energy Consumption, Section 13: CIBSE Guide D, Transportation Systems in Buildings (The Chartered Institution of Building Services Engineers)(2000) ISBN 1 903287 09 X
- Doolard D A Energy Consumption of different types of lift drive system Elevator Technology 4, Proceedings of ELEVCON 1992 (The International Association of Elevator Engineers) (1992)
- Schroeder J The Energy Consumption of Elevators Elevator Technology 1, (Chichester: Ellis Horwood) (1986)
- Siikonen M On Traffic Planning Methodology Elevator Technology 10, Proceedings of ELEVCON 2000 (The International Association of Elevator Engineers) (2000)